Advertisement
- Switzerland
- /
- Luxury
- /
- SWX:CFR
Does Richemont’s Recent 18.9% Rally Signal Room for Further Growth in 2025?

Simply Wall St
Reviewed by Bailey Pemberton
If you are weighing your options with Compagnie Financière Richemont, you are not alone. This stock has steadily grabbed the market's attention, performing like a hidden gem that keeps rewarding patient investors. Over the past week alone, Richemont shares climbed 2.9%, and in the last month, they rallied 7.6%. Stretch that timeline further, and the impressive 15.9% gain year-to-date is matched by a striking 18.9% return over the last year. Looking even further back, the long-term gains stand out: 73.5% in three years and a remarkable 180.4% across five years. Recent upward moves have been fueled in part by ongoing shifts in global luxury demand, with investors responding positively to signs of resilient spending in the high-end retail sector.
Of course, strong price performance is just one piece of the puzzle. With all this momentum, you may be wondering if Richemont still offers good value or if the train has already left the station. According to our six-pronged valuation framework, Richemont comes in with a value score of just 2, underscoring that it is considered undervalued in only two of the six key checks we use. That mixed score is worth unpacking in detail, especially if you are on the fence about buying, holding, or selling.
Let's break down how Richemont stacks up under the major valuation approaches. Then, I will share a smart way to read between the lines and get an even clearer sense of the company's true value.
Compagnie Financière Richemont scores just 2/6 on our valuation checks. See what other red flags we found in the full valuation breakdown.
Approach 1: Compagnie Financière Richemont Discounted Cash Flow (DCF) Analysis
The Discounted Cash Flow (DCF) valuation method estimates what a company is truly worth by predicting its future cash flows and then discounting them back to today’s value. This approach considers more than short-term profits and focuses on the net amount of cash Richemont can generate for shareholders over the long term.
Richemont’s latest twelve-month Free Cash Flow is approximately €3.35 billion. Analysts forecast relatively stable cash flows, with projections for 2030 around €3.3 billion. Analyst consensus offers reasonably strong estimates for the next five years, and figures beyond that are extrapolated to provide a ten-year perspective.
Using the 2 Stage Free Cash Flow to Equity model, the resulting intrinsic or “fair” value is calculated at €93.37 per Richemont share. However, the current share price is 66.6% higher than this intrinsic value. In other words, the DCF indicates that Richemont stock is trading well above its underlying cash flow potential at present.
Result: OVERVALUED
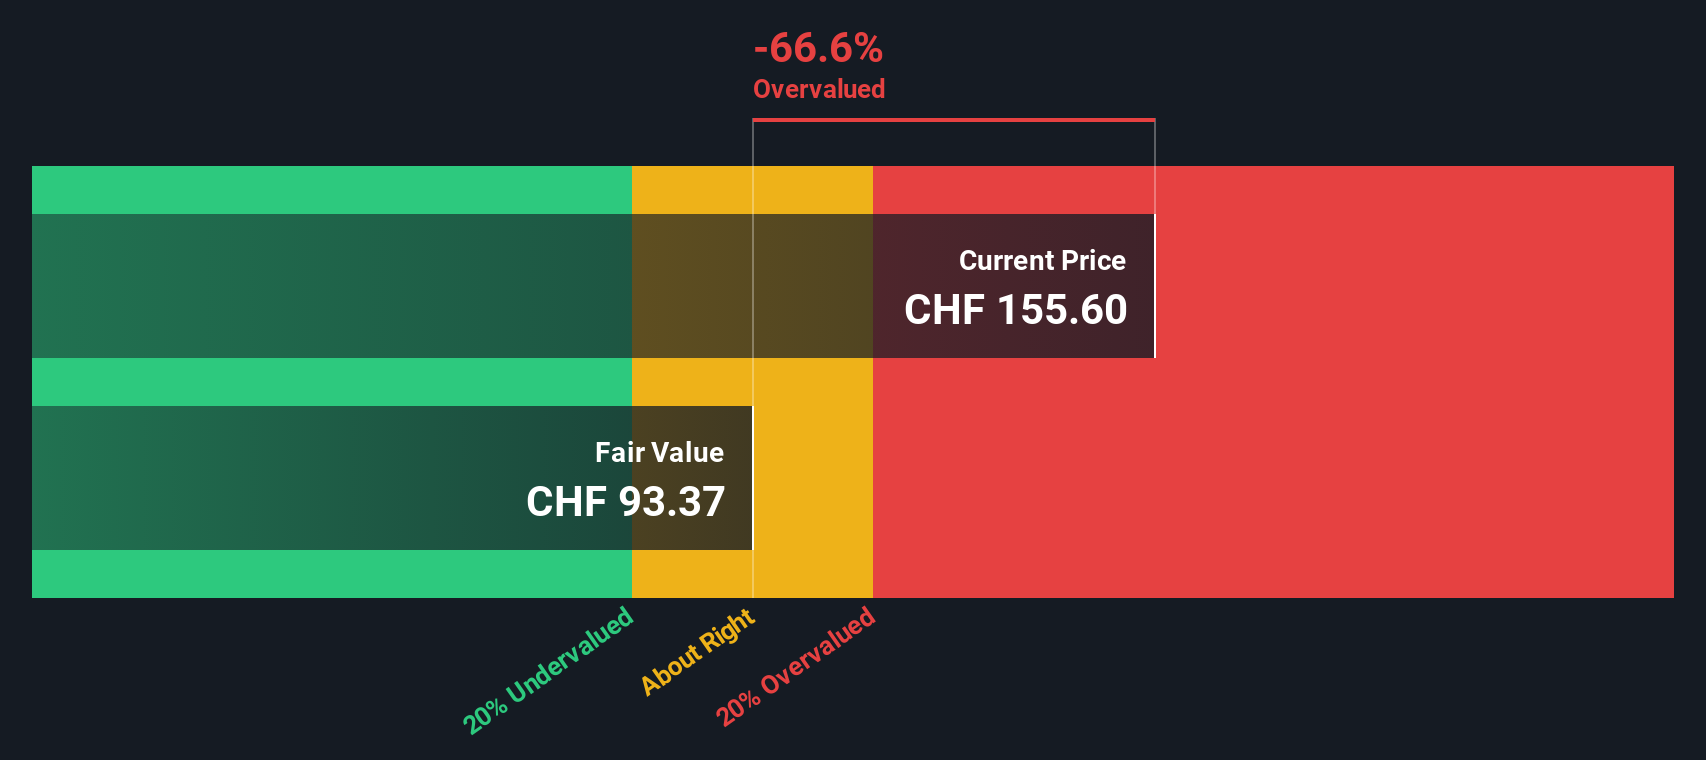
Our Discounted Cash Flow (DCF) analysis suggests Compagnie Financière Richemont may be overvalued by 66.6%. Find undervalued stocks or create your own screener to find better value opportunities.
Approach 2: Compagnie Financière Richemont Price vs Earnings
The Price-to-Earnings (PE) ratio is widely recognized as a valuable tool for valuing profitable companies like Richemont because it connects the current share price directly to the company’s actual earnings. It offers investors a simple way to gauge how much the market is willing to pay for each franc of profits, which is especially useful when a company consistently generates healthy earnings.
What counts as a “normal” or fair PE ratio depends on several factors, including growth expectations and risk. Higher growth prospects or lower risk typically justify a higher PE, since investors will pay up for better future returns and greater certainty. However, if earnings growth slows or risk increases, the fair value comes down.
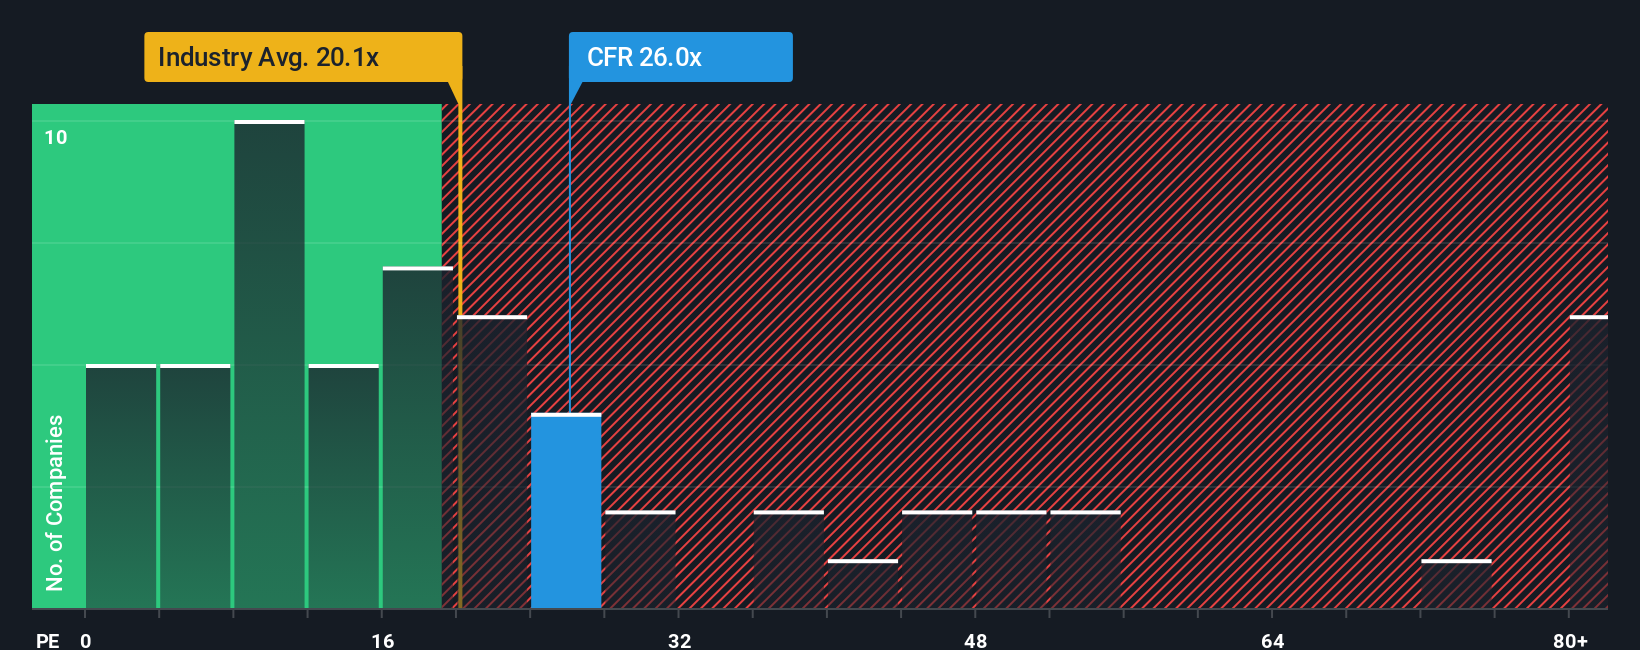
Right now, Richemont trades at 26x earnings. The average PE ratio for other luxury industry names is 18.7x, while the broader peer average is 57x. At a glance, Richemont sits between the industry standard and its pricier peers.
This is where Simply Wall St’s “Fair Ratio” comes in. The Fair Ratio for Richemont is calculated at 27.7x, which reflects an optimal multiple based on a detailed blend of factors like earnings growth, profit margins, industry trends, company size, and unique risks. Unlike simple peer or industry comparisons, the Fair Ratio incorporates these elements into a sophisticated benchmark for what Richemont should trade at in today’s market.
Since Richemont’s current PE of 26x is only slightly below the Fair Ratio of 27.7x, the stock is priced just about where it should be based on its specific fundamentals.
Result: ABOUT RIGHT
PE ratios tell one story, but what if the real opportunity lies elsewhere? Discover companies where insiders are betting big on explosive growth.
Upgrade Your Decision Making: Choose your Compagnie Financière Richemont Narrative
Earlier we mentioned that there is an even better way to understand valuation, so let us introduce you to Narratives, an approach that brings together numbers and stories to give your investment decision true context. In simple terms, a Narrative lets you (or any investor) create a story about Richemont’s future by combining your own assumptions for revenue, earnings, and margins with your interpretation of industry shifts, leadership changes, or macroeconomic risks. Narratives link a company's unique situation and outlook to a tailored financial forecast, resulting in your own Fair Value estimate.
This approach is easy and accessible for everyone on Simply Wall St’s Community page, which millions of investors use to share, compare, and refine their perspectives. Narratives empower you to see how your view of Richemont’s story, whether optimistic or cautious, stacks up against the current share price, helping you decide when to buy, hold, or sell. Because Narratives automatically update as new events and data are reported, your analysis stays relevant and up-to-date.
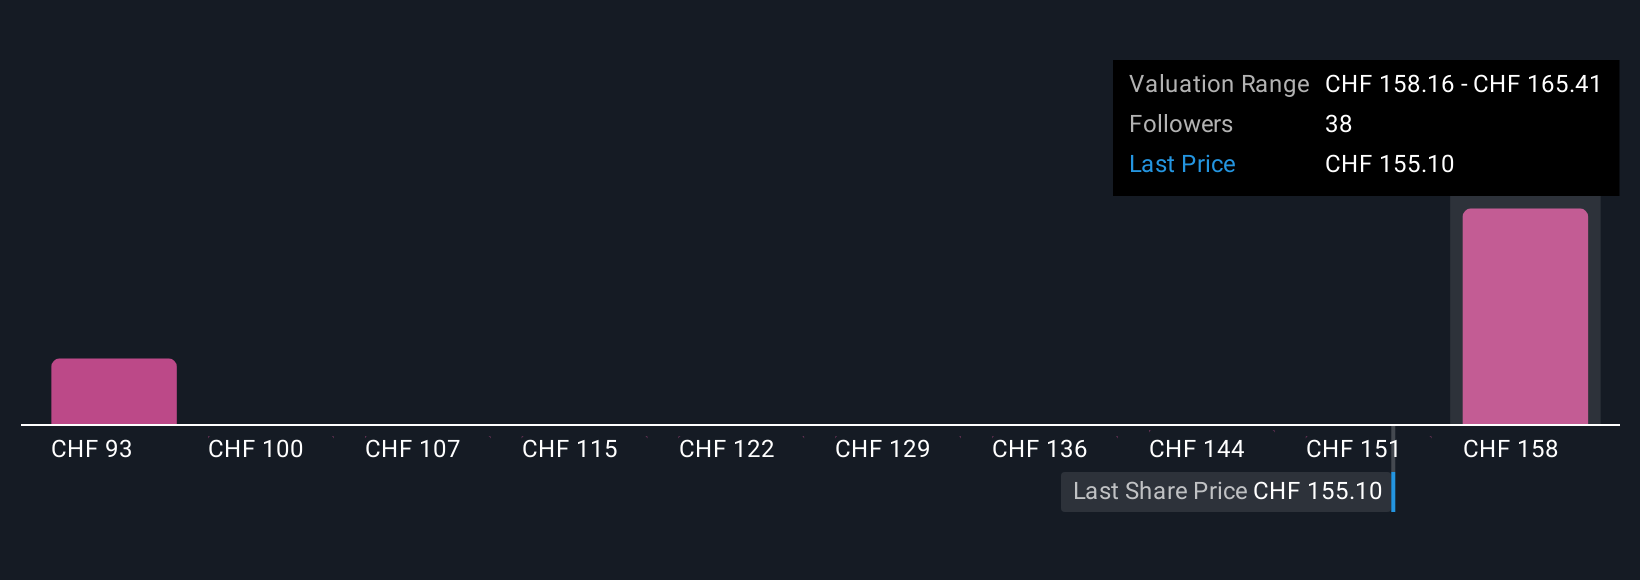
For example, some investors believe Richemont is worth as much as CHF191.19 per share based on bold growth expectations, while others see downside risks and value it as low as CHF128.71. Your view and story can fit anywhere in between.
Do you think there's more to the story for Compagnie Financière Richemont? Create your own Narrative to let the Community know!
This article by Simply Wall St is general in nature. We provide commentary based on historical data and analyst forecasts only using an unbiased methodology and our articles are not intended to be financial advice. It does not constitute a recommendation to buy or sell any stock, and does not take account of your objectives, or your financial situation. We aim to bring you long-term focused analysis driven by fundamental data. Note that our analysis may not factor in the latest price-sensitive company announcements or qualitative material. Simply Wall St has no position in any stocks mentioned.
New: AI Stock Screener & Alerts
Our new AI Stock Screener scans the market every day to uncover opportunities.
• Dividend Powerhouses (3%+ Yield)
• Undervalued Small Caps with Insider Buying
• High growth Tech and AI Companies
Or build your own from over 50 metrics.
Have feedback on this article? Concerned about the content? Get in touch with us directly. Alternatively, email editorial-team@simplywallst.com
About SWX:CFR
Compagnie Financière Richemont
An investment holding company, engages in the luxury goods business.
Flawless balance sheet with proven track record.
Market Insights

Advertisement
Community Narratives
MicroVision will explode future revenue by 380.37% with a vision towards success
Fair Value US$60.00|98.4% undervalued
TH
Community Contributor
The Indispensable Artery for a New North American Economy
Fair Value CA$132.87|1.3% undervalued
TI
Community Contributor