- Switzerland
- /
- Professional Services
- /
- SWX:ADEN
Adecco Group (VTX:ADEN) stock falls 5.1% in past week as five-year earnings and shareholder returns continue downward trend


Ideally, your overall portfolio should beat the market average. But in any portfolio, there will be mixed results between individual stocks. So we wouldn't blame long term Adecco Group AG (VTX:ADEN) shareholders for doubting their decision to hold, with the stock down 52% over a half decade. And we doubt long term believers are the only worried holders, since the stock price has declined 26% over the last twelve months. Shareholders have had an even rougher run lately, with the share price down 16% in the last 90 days.
Since Adecco Group has shed CHF248m from its value in the past 7 days, let's see if the longer term decline has been driven by the business' economics.
See our latest analysis for Adecco Group
While the efficient markets hypothesis continues to be taught by some, it has been proven that markets are over-reactive dynamic systems, and investors are not always rational. By comparing earnings per share (EPS) and share price changes over time, we can get a feel for how investor attitudes to a company have morphed over time.
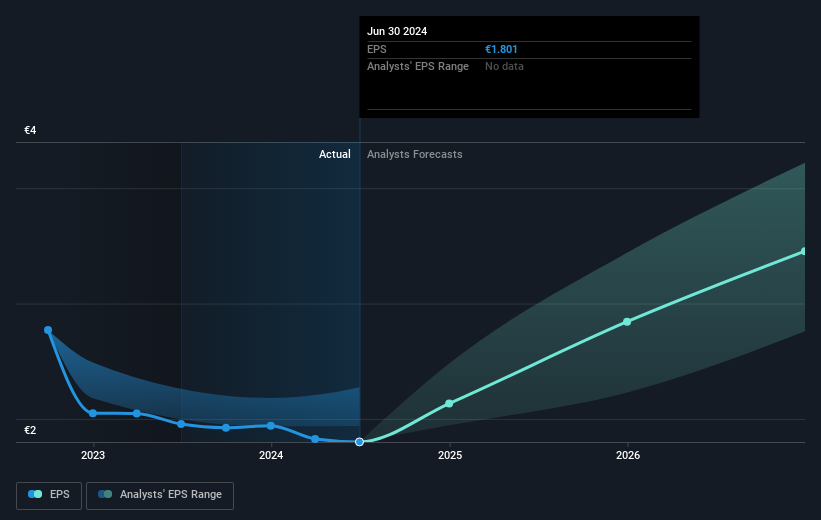
Looking back five years, both Adecco Group's share price and EPS declined; the latter at a rate of 8.1% per year. Readers should note that the share price has fallen faster than the EPS, at a rate of 14% per year, over the period. This implies that the market is more cautious about the business these days.
You can see how EPS has changed over time in the image below (click on the chart to see the exact values).
This free interactive report on Adecco Group's earnings, revenue and cash flow is a great place to start, if you want to investigate the stock further.
What About Dividends?
As well as measuring the share price return, investors should also consider the total shareholder return (TSR). The TSR is a return calculation that accounts for the value of cash dividends (assuming that any dividend received was reinvested) and the calculated value of any discounted capital raisings and spin-offs. So for companies that pay a generous dividend, the TSR is often a lot higher than the share price return. As it happens, Adecco Group's TSR for the last 5 years was -34%, which exceeds the share price return mentioned earlier. This is largely a result of its dividend payments!
A Different Perspective
Adecco Group shareholders are down 20% for the year (even including dividends), but the market itself is up 9.2%. However, keep in mind that even the best stocks will sometimes underperform the market over a twelve month period. Regrettably, last year's performance caps off a bad run, with the shareholders facing a total loss of 6% per year over five years. Generally speaking long term share price weakness can be a bad sign, though contrarian investors might want to research the stock in hope of a turnaround. I find it very interesting to look at share price over the long term as a proxy for business performance. But to truly gain insight, we need to consider other information, too. To that end, you should be aware of the 3 warning signs we've spotted with Adecco Group .
If you are like me, then you will not want to miss this free list of undervalued small caps that insiders are buying.
Please note, the market returns quoted in this article reflect the market weighted average returns of stocks that currently trade on Swiss exchanges.
New: Manage All Your Stock Portfolios in One Place
We've created the ultimate portfolio companion for stock investors, and it's free.
• Connect an unlimited number of Portfolios and see your total in one currency
• Be alerted to new Warning Signs or Risks via email or mobile
• Track the Fair Value of your stocks
Have feedback on this article? Concerned about the content? Get in touch with us directly. Alternatively, email editorial-team (at) simplywallst.com.
This article by Simply Wall St is general in nature. We provide commentary based on historical data and analyst forecasts only using an unbiased methodology and our articles are not intended to be financial advice. It does not constitute a recommendation to buy or sell any stock, and does not take account of your objectives, or your financial situation. We aim to bring you long-term focused analysis driven by fundamental data. Note that our analysis may not factor in the latest price-sensitive company announcements or qualitative material. Simply Wall St has no position in any stocks mentioned.
About SWX:ADEN
Adecco Group
Provides human resource services to businesses and organizations in Europe, North America, Asia Pacific, South America, and North Africa.
Undervalued with moderate growth potential.

