
Advertisement
- Switzerland
- /
- Machinery
- /
- SWX:VACN
These 4 Measures Indicate That VAT Group (VTX:VACN) Is Using Debt Safely

Legendary fund manager Li Lu (who Charlie Munger backed) once said, 'The biggest investment risk is not the volatility of prices, but whether you will suffer a permanent loss of capital.' So it seems the smart money knows that debt - which is usually involved in bankruptcies - is a very important factor, when you assess how risky a company is. We note that VAT Group AG (VTX:VACN) does have debt on its balance sheet. But the more important question is: how much risk is that debt creating?
When Is Debt A Problem?
Generally speaking, debt only becomes a real problem when a company can't easily pay it off, either by raising capital or with its own cash flow. Part and parcel of capitalism is the process of 'creative destruction' where failed businesses are mercilessly liquidated by their bankers. However, a more frequent (but still costly) occurrence is where a company must issue shares at bargain-basement prices, permanently diluting shareholders, just to shore up its balance sheet. Having said that, the most common situation is where a company manages its debt reasonably well - and to its own advantage. When we examine debt levels, we first consider both cash and debt levels, together.
How Much Debt Does VAT Group Carry?
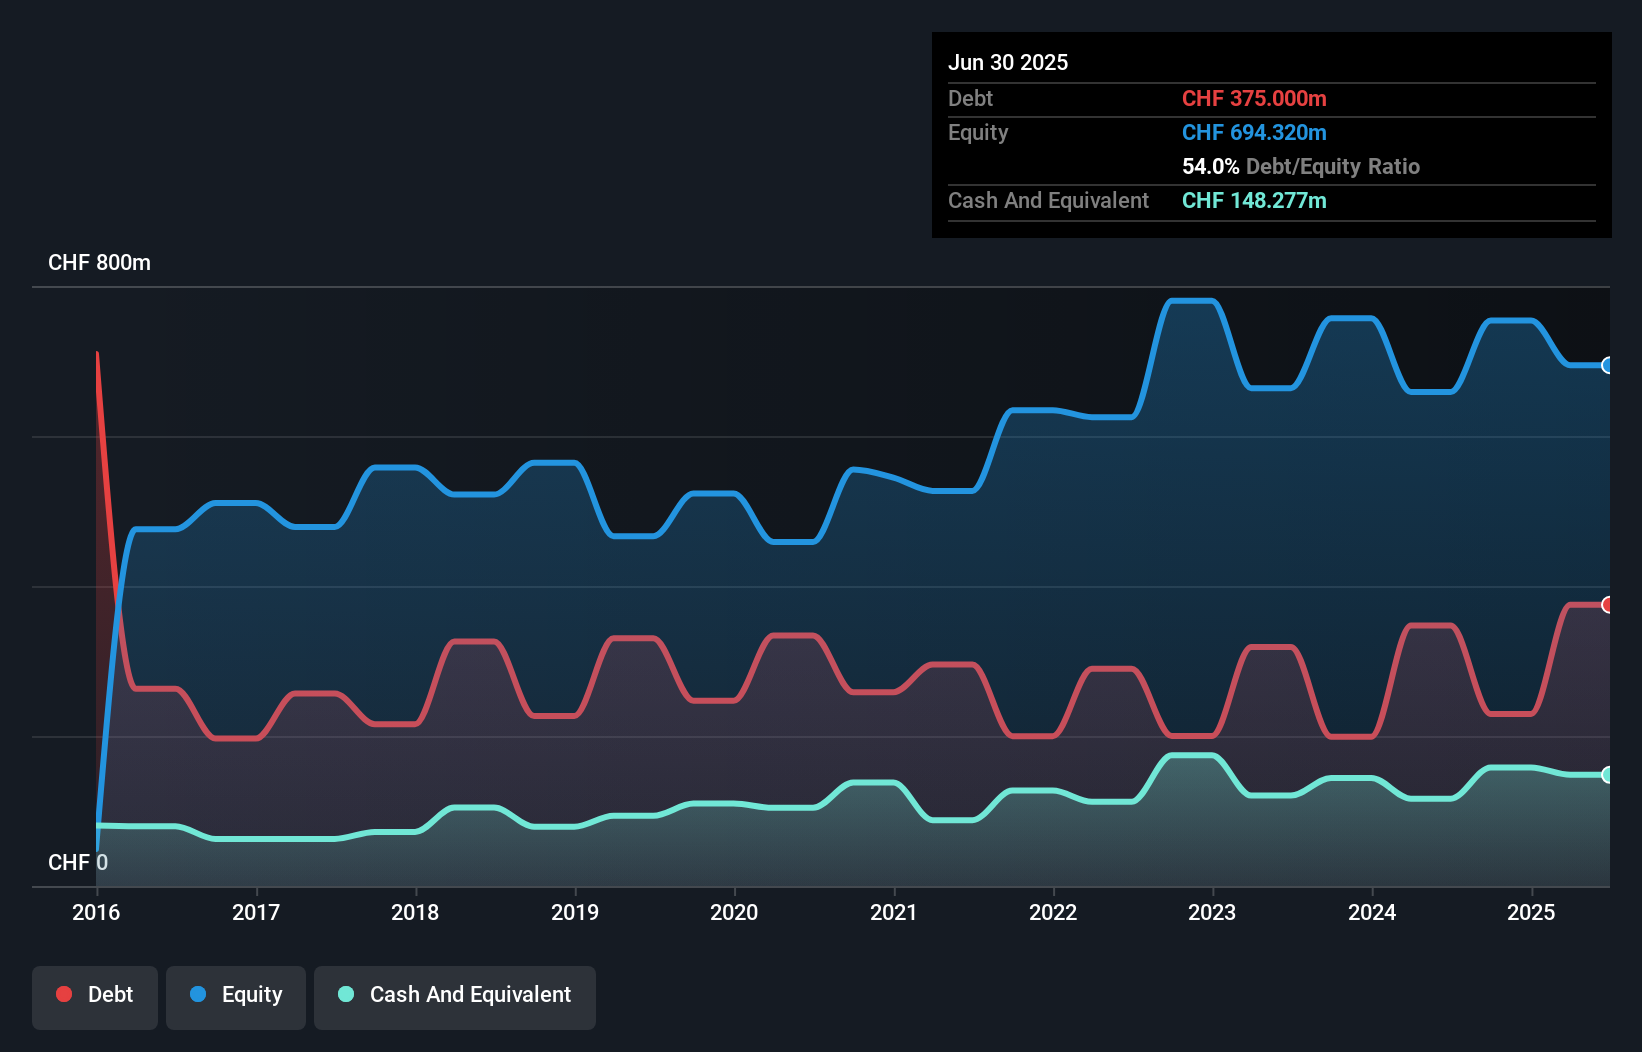
The image below, which you can click on for greater detail, shows that at June 2025 VAT Group had debt of CHF375.0m, up from CHF347.2m in one year. However, it does have CHF148.3m in cash offsetting this, leading to net debt of about CHF226.7m.
How Healthy Is VAT Group's Balance Sheet?
The latest balance sheet data shows that VAT Group had liabilities of CHF391.2m due within a year, and liabilities of CHF271.9m falling due after that. On the other hand, it had cash of CHF148.3m and CHF160.9m worth of receivables due within a year. So its liabilities outweigh the sum of its cash and (near-term) receivables by CHF354.0m.
Of course, VAT Group has a titanic market capitalization of CHF8.54b, so these liabilities are probably manageable. But there are sufficient liabilities that we would certainly recommend shareholders continue to monitor the balance sheet, going forward.
View our latest analysis for VAT Group
We measure a company's debt load relative to its earnings power by looking at its net debt divided by its earnings before interest, tax, depreciation, and amortization (EBITDA) and by calculating how easily its earnings before interest and tax (EBIT) cover its interest expense (interest cover). Thus we consider debt relative to earnings both with and without depreciation and amortization expenses.
VAT Group's net debt is only 0.72 times its EBITDA. And its EBIT easily covers its interest expense, being 15.5 times the size. So we're pretty relaxed about its super-conservative use of debt. In addition to that, we're happy to report that VAT Group has boosted its EBIT by 31%, thus reducing the spectre of future debt repayments. When analysing debt levels, the balance sheet is the obvious place to start. But ultimately the future profitability of the business will decide if VAT Group can strengthen its balance sheet over time. So if you want to see what the professionals think, you might find this free report on analyst profit forecasts to be interesting.
But our final consideration is also important, because a company cannot pay debt with paper profits; it needs cold hard cash. So we always check how much of that EBIT is translated into free cash flow. During the last three years, VAT Group produced sturdy free cash flow equating to 74% of its EBIT, about what we'd expect. This cold hard cash means it can reduce its debt when it wants to.
Our View
Happily, VAT Group's impressive interest cover implies it has the upper hand on its debt. And that's just the beginning of the good news since its EBIT growth rate is also very heartening. Considering this range of factors, it seems to us that VAT Group is quite prudent with its debt, and the risks seem well managed. So we're not worried about the use of a little leverage on the balance sheet. Above most other metrics, we think its important to track how fast earnings per share is growing, if at all. If you've also come to that realization, you're in luck, because today you can view this interactive graph of VAT Group's earnings per share history for free.
If, after all that, you're more interested in a fast growing company with a rock-solid balance sheet, then check out our list of net cash growth stocks without delay.
New: Manage All Your Stock Portfolios in One Place
We've created the ultimate portfolio companion for stock investors, and it's free.
• Connect an unlimited number of Portfolios and see your total in one currency
• Be alerted to new Warning Signs or Risks via email or mobile
• Track the Fair Value of your stocks
Have feedback on this article? Concerned about the content? Get in touch with us directly. Alternatively, email editorial-team (at) simplywallst.com.
This article by Simply Wall St is general in nature. We provide commentary based on historical data and analyst forecasts only using an unbiased methodology and our articles are not intended to be financial advice. It does not constitute a recommendation to buy or sell any stock, and does not take account of your objectives, or your financial situation. We aim to bring you long-term focused analysis driven by fundamental data. Note that our analysis may not factor in the latest price-sensitive company announcements or qualitative material. Simply Wall St has no position in any stocks mentioned.
About SWX:VACN
VAT Group
Develops, manufactures, and sells vacuum and gas inlet valves, multi-valve modules, motion components, and edge-welded metal bellows.
Flawless balance sheet with solid track record.
Similar Companies
Market Insights


Advertisement
Community Narratives
The Next Phase of Energy Storage: How NeoVolta Is Tackling America’s Power Crunch
Fair Value US$7.50|35.6% undervalued
MA
Community Contributor
Why EnSilica is Worth Possibly 13x its Current Price
Fair Value UK£5.00|90.0% undervalued
DO
Community Contributor
M&A Activity, Industry Diversification & A Defense Contract Monopoly Will Push BWXT For Healthy Long-Term Growth
Fair Value US$220.00|14.9% undervalued
CL
Community Contributor
A case for Cassiar Gold Corp (TSXV: GLDC) to reach CAD$8-10 before 2030 (X30-37)
Fair Value CA$10.00|97.2% undervalued
AG
Community Contributor