
Advertisement
Key Insights
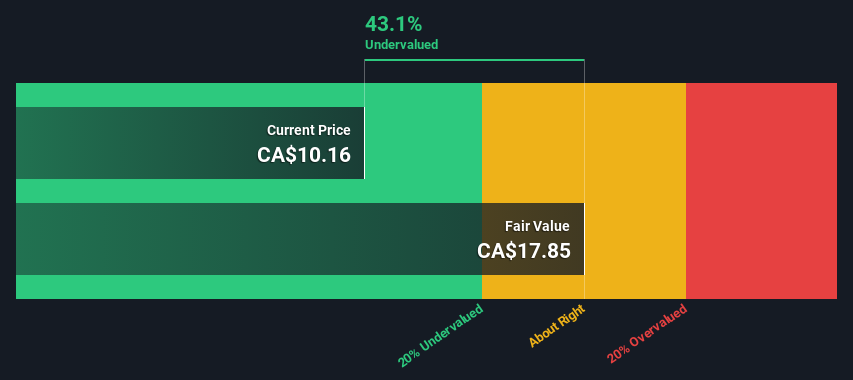
- Using the 2 Stage Free Cash Flow to Equity, Superior Plus fair value estimate is CA$17.85
- Superior Plus' CA$10.16 share price signals that it might be 43% undervalued
- The CA$13.65 analyst price target for SPB is 24% less than our estimate of fair value
Does the August share price for Superior Plus Corp. (TSE:SPB) reflect what it's really worth? Today, we will estimate the stock's intrinsic value by taking the forecast future cash flows of the company and discounting them back to today's value. This will be done using the Discounted Cash Flow (DCF) model. Before you think you won't be able to understand it, just read on! It's actually much less complex than you'd imagine.
Companies can be valued in a lot of ways, so we would point out that a DCF is not perfect for every situation. For those who are keen learners of equity analysis, the Simply Wall St analysis model here may be something of interest to you.
Check out our latest analysis for Superior Plus
What's The Estimated Valuation?
We use what is known as a 2-stage model, which simply means we have two different periods of growth rates for the company's cash flows. Generally the first stage is higher growth, and the second stage is a lower growth phase. To begin with, we have to get estimates of the next ten years of cash flows. Where possible we use analyst estimates, but when these aren't available we extrapolate the previous free cash flow (FCF) from the last estimate or reported value. We assume companies with shrinking free cash flow will slow their rate of shrinkage, and that companies with growing free cash flow will see their growth rate slow, over this period. We do this to reflect that growth tends to slow more in the early years than it does in later years.
A DCF is all about the idea that a dollar in the future is less valuable than a dollar today, so we discount the value of these future cash flows to their estimated value in today's dollars:
10-year free cash flow (FCF) estimate
| 2024 | 2025 | 2026 | 2027 | 2028 | 2029 | 2030 | 2031 | 2032 | 2033 | |
| Levered FCF (CA$, Millions) | CA$286.0m | CA$267.4m | CA$256.6m | CA$250.8m | CA$248.2m | CA$247.7m | CA$248.7m | CA$250.7m | CA$253.5m | CA$256.9m |
| Growth Rate Estimate Source | Analyst x2 | Est @ -6.51% | Est @ -4.02% | Est @ -2.27% | Est @ -1.05% | Est @ -0.20% | Est @ 0.40% | Est @ 0.82% | Est @ 1.12% | Est @ 1.32% |
| Present Value (CA$, Millions) Discounted @ 6.9% | CA$268 | CA$234 | CA$210 | CA$192 | CA$178 | CA$166 | CA$156 | CA$147 | CA$139 | CA$132 |
("Est" = FCF growth rate estimated by Simply Wall St)
Present Value of 10-year Cash Flow (PVCF) = CA$1.8b
The second stage is also known as Terminal Value, this is the business's cash flow after the first stage. For a number of reasons a very conservative growth rate is used that cannot exceed that of a country's GDP growth. In this case we have used the 5-year average of the 10-year government bond yield (1.8%) to estimate future growth. In the same way as with the 10-year 'growth' period, we discount future cash flows to today's value, using a cost of equity of 6.9%.
Terminal Value (TV)= FCF2033 × (1 + g) ÷ (r – g) = CA$257m× (1 + 1.8%) ÷ (6.9%– 1.8%) = CA$5.1b
Present Value of Terminal Value (PVTV)= TV / (1 + r)10= CA$5.1b÷ ( 1 + 6.9%)10= CA$2.6b
The total value, or equity value, is then the sum of the present value of the future cash flows, which in this case is CA$4.4b. In the final step we divide the equity value by the number of shares outstanding. Relative to the current share price of CA$10.2, the company appears quite good value at a 43% discount to where the stock price trades currently. The assumptions in any calculation have a big impact on the valuation, so it is better to view this as a rough estimate, not precise down to the last cent.
Important Assumptions
The calculation above is very dependent on two assumptions. The first is the discount rate and the other is the cash flows. Part of investing is coming up with your own evaluation of a company's future performance, so try the calculation yourself and check your own assumptions. The DCF also does not consider the possible cyclicality of an industry, or a company's future capital requirements, so it does not give a full picture of a company's potential performance. Given that we are looking at Superior Plus as potential shareholders, the cost of equity is used as the discount rate, rather than the cost of capital (or weighted average cost of capital, WACC) which accounts for debt. In this calculation we've used 6.9%, which is based on a levered beta of 0.859. Beta is a measure of a stock's volatility, compared to the market as a whole. We get our beta from the industry average beta of globally comparable companies, with an imposed limit between 0.8 and 2.0, which is a reasonable range for a stable business.
SWOT Analysis for Superior Plus
Strength
- Debt is well covered by cash flow.
- Dividend is in the top 25% of dividend payers in the market.
Weakness
- Interest payments on debt are not well covered.
- Shareholders have been diluted in the past year.
Opportunity
- Expected to breakeven next year.
- Has sufficient cash runway for more than 3 years based on current free cash flows.
- Good value based on P/S ratio and estimated fair value.
- Significant insider buying over the past 3 months.
Threat
- Paying a dividend but company is unprofitable.
Looking Ahead:
Whilst important, the DCF calculation shouldn't be the only metric you look at when researching a company. DCF models are not the be-all and end-all of investment valuation. Preferably you'd apply different cases and assumptions and see how they would impact the company's valuation. For instance, if the terminal value growth rate is adjusted slightly, it can dramatically alter the overall result. Can we work out why the company is trading at a discount to intrinsic value? For Superior Plus, we've compiled three pertinent aspects you should assess:
- Risks: Be aware that Superior Plus is showing 3 warning signs in our investment analysis , and 1 of those doesn't sit too well with us...
- Management:Have insiders been ramping up their shares to take advantage of the market's sentiment for SPB's future outlook? Check out our management and board analysis with insights on CEO compensation and governance factors.
- Other High Quality Alternatives: Do you like a good all-rounder? Explore our interactive list of high quality stocks to get an idea of what else is out there you may be missing!
PS. Simply Wall St updates its DCF calculation for every Canadian stock every day, so if you want to find the intrinsic value of any other stock just search here.
New: Manage All Your Stock Portfolios in One Place
We've created the ultimate portfolio companion for stock investors, and it's free.
• Connect an unlimited number of Portfolios and see your total in one currency
• Be alerted to new Warning Signs or Risks via email or mobile
• Track the Fair Value of your stocks
Have feedback on this article? Concerned about the content? Get in touch with us directly. Alternatively, email editorial-team (at) simplywallst.com.
This article by Simply Wall St is general in nature. We provide commentary based on historical data and analyst forecasts only using an unbiased methodology and our articles are not intended to be financial advice. It does not constitute a recommendation to buy or sell any stock, and does not take account of your objectives, or your financial situation. We aim to bring you long-term focused analysis driven by fundamental data. Note that our analysis may not factor in the latest price-sensitive company announcements or qualitative material. Simply Wall St has no position in any stocks mentioned.
About TSX:SPB
Superior Plus
Distributes propane, compressed natural gas, and renewable energy and related products and services in the United States and Canada.
Fair value with moderate growth potential.
Similar Companies
Market Insights

Advertisement
Community Narratives
MicroVision will explode future revenue by 380.37% with a vision towards success
Fair Value US$60|98.4% undervalued
TH
Community Contributor
The Indispensable Artery for a New North American Economy
Fair Value CA$132.87|0.6% undervalued
TI
Community Contributor
Recently Updated Narratives
MA


MarkoVT on COVER ·
Q3 Outlook modestly optimistic
Fair Value:JP¥1.65k2.0% overvalued
1 followerusers have followed this narrative
0 commentsusers have commented on this narrative
0 likesusers have liked this narrative
BL


BlackGoat on Alphabet ·
Alphabet: The Under-appreciated Compounder Hiding in Plain Sight
Fair Value:US$324.481.3% undervalued
77 followersusers have followed this narrative
3 commentsusers have commented on this narrative
1 likeusers have liked this narrative
BE


Bejgal on MINISO Group Holding ·
MINISO's fair value is projected at 26.69 with an anticipated PE ratio shift of 20x
Fair Value:US$26.6926.7% undervalued
46 followersusers have followed this narrative
3 commentsusers have commented on this narrative
0 likesusers have liked this narrative
Popular Narratives
OS

oscargarcia on Alphabet ·
The company that turned a verb into a global necessity and basically runs the modern internet, digital ads, smartphones, maps, and AI.
Fair Value:US$3405.9% undervalued
136 followersusers have followed this narrative
6 commentsusers have commented on this narrative
18 likesusers have liked this narrative
TH

TheWallstreetKing on MicroVision ·
MicroVision will explode future revenue by 380.37% with a vision towards success
Fair Value:US$6098.4% undervalued
91 followersusers have followed this narrative
10 commentsusers have commented on this narrative
18 likesusers have liked this narrative
AN


AnalystConsensusTarget on NVIDIA ·
NVDA: Expanding AI Demand Will Drive Major Data Center Investments Through 2026
Fair Value:US$232.7922.6% undervalued
928 followersusers have followed this narrative
6 commentsusers have commented on this narrative
22 likesusers have liked this narrative