- Canada
- /
- Renewable Energy
- /
- TSX:PIF
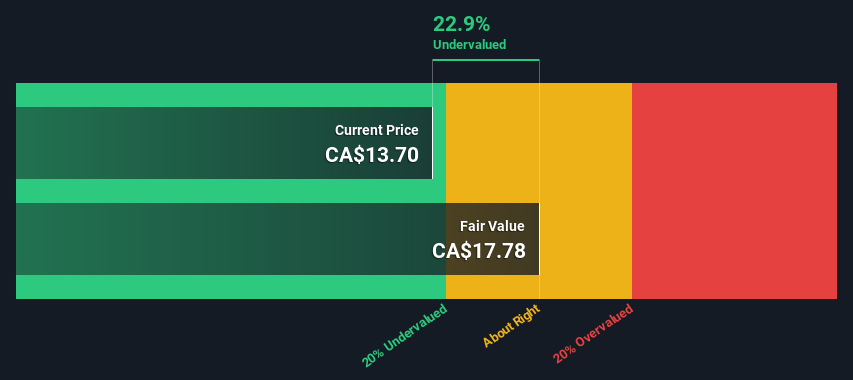
Is Polaris Renewable Energy Inc. (TSE:PIF) Trading At A 23% Discount?

Key Insights
- The projected fair value for Polaris Renewable Energy is CA$17.78 based on 2 Stage Free Cash Flow to Equity
- Current share price of CA$13.70 suggests Polaris Renewable Energy is potentially 23% undervalued
- Analyst price target for PIF is US$20.87, which is 17% above our fair value estimate
In this article we are going to estimate the intrinsic value of Polaris Renewable Energy Inc. (TSE:PIF) by taking the expected future cash flows and discounting them to their present value. This will be done using the Discounted Cash Flow (DCF) model. Before you think you won't be able to understand it, just read on! It's actually much less complex than you'd imagine.
Companies can be valued in a lot of ways, so we would point out that a DCF is not perfect for every situation. If you want to learn more about discounted cash flow, the rationale behind this calculation can be read in detail in the Simply Wall St analysis model.
See our latest analysis for Polaris Renewable Energy
Is Polaris Renewable Energy Fairly Valued?
We are going to use a two-stage DCF model, which, as the name states, takes into account two stages of growth. The first stage is generally a higher growth period which levels off heading towards the terminal value, captured in the second 'steady growth' period. To start off with, we need to estimate the next ten years of cash flows. Where possible we use analyst estimates, but when these aren't available we extrapolate the previous free cash flow (FCF) from the last estimate or reported value. We assume companies with shrinking free cash flow will slow their rate of shrinkage, and that companies with growing free cash flow will see their growth rate slow, over this period. We do this to reflect that growth tends to slow more in the early years than it does in later years.
A DCF is all about the idea that a dollar in the future is less valuable than a dollar today, so we discount the value of these future cash flows to their estimated value in today's dollars:
10-year free cash flow (FCF) estimate
| 2024 | 2025 | 2026 | 2027 | 2028 | 2029 | 2030 | 2031 | 2032 | 2033 | |
| Levered FCF ($, Millions) | US$32.7m | US$22.2m | US$16.9m | US$14.1m | US$12.6m | US$11.8m | US$11.3m | US$11.0m | US$10.9m | US$10.9m |
| Growth Rate Estimate Source | Analyst x1 | Analyst x1 | Est @ -24.02% | Est @ -16.19% | Est @ -10.71% | Est @ -6.87% | Est @ -4.19% | Est @ -2.31% | Est @ -0.99% | Est @ -0.07% |
| Present Value ($, Millions) Discounted @ 6.1% | US$30.8 | US$19.7 | US$14.1 | US$11.2 | US$9.4 | US$8.2 | US$7.4 | US$6.9 | US$6.4 | US$6.0 |
("Est" = FCF growth rate estimated by Simply Wall St)
Present Value of 10-year Cash Flow (PVCF) = US$120m
The second stage is also known as Terminal Value, this is the business's cash flow after the first stage. The Gordon Growth formula is used to calculate Terminal Value at a future annual growth rate equal to the 5-year average of the 10-year government bond yield of 2.1%. We discount the terminal cash flows to today's value at a cost of equity of 6.1%.
Terminal Value (TV)= FCF2033 × (1 + g) ÷ (r – g) = US$11m× (1 + 2.1%) ÷ (6.1%– 2.1%) = US$277m
Present Value of Terminal Value (PVTV)= TV / (1 + r)10= US$277m÷ ( 1 + 6.1%)10= US$153m
The total value is the sum of cash flows for the next ten years plus the discounted terminal value, which results in the Total Equity Value, which in this case is US$273m. To get the intrinsic value per share, we divide this by the total number of shares outstanding. Compared to the current share price of CA$13.7, the company appears a touch undervalued at a 23% discount to where the stock price trades currently. Remember though, that this is just an approximate valuation, and like any complex formula - garbage in, garbage out.
Important Assumptions
Now the most important inputs to a discounted cash flow are the discount rate, and of course, the actual cash flows. Part of investing is coming up with your own evaluation of a company's future performance, so try the calculation yourself and check your own assumptions. The DCF also does not consider the possible cyclicality of an industry, or a company's future capital requirements, so it does not give a full picture of a company's potential performance. Given that we are looking at Polaris Renewable Energy as potential shareholders, the cost of equity is used as the discount rate, rather than the cost of capital (or weighted average cost of capital, WACC) which accounts for debt. In this calculation we've used 6.1%, which is based on a levered beta of 0.872. Beta is a measure of a stock's volatility, compared to the market as a whole. We get our beta from the industry average beta of globally comparable companies, with an imposed limit between 0.8 and 2.0, which is a reasonable range for a stable business.
SWOT Analysis for Polaris Renewable Energy
- Earnings growth over the past year exceeded the industry.
- Debt is well covered by cash flow.
- Interest payments on debt are not well covered.
- Dividend is low compared to the top 25% of dividend payers in the Renewable Energy market.
- Trading below our estimate of fair value by more than 20%.
- Significant insider buying over the past 3 months.
- Dividends are not covered by earnings.
- Annual earnings are forecast to decline for the next 2 years.
Next Steps:
Although the valuation of a company is important, it is only one of many factors that you need to assess for a company. It's not possible to obtain a foolproof valuation with a DCF model. Preferably you'd apply different cases and assumptions and see how they would impact the company's valuation. For instance, if the terminal value growth rate is adjusted slightly, it can dramatically alter the overall result. What is the reason for the share price sitting below the intrinsic value? For Polaris Renewable Energy, we've compiled three further items you should consider:
- Risks: Take risks, for example - Polaris Renewable Energy has 3 warning signs (and 2 which shouldn't be ignored) we think you should know about.
- Management:Have insiders been ramping up their shares to take advantage of the market's sentiment for PIF's future outlook? Check out our management and board analysis with insights on CEO compensation and governance factors.
- Other Solid Businesses: Low debt, high returns on equity and good past performance are fundamental to a strong business. Why not explore our interactive list of stocks with solid business fundamentals to see if there are other companies you may not have considered!
PS. Simply Wall St updates its DCF calculation for every Canadian stock every day, so if you want to find the intrinsic value of any other stock just search here.
Mobile Infrastructure for Defense and Disaster
The next wave in robotics isn't humanoid. Its fully autonomous towers delivering 5G, ISR, and radar in under 30 minutes, anywhere.
Get the investor briefing before the next round of contracts
Sponsored On Behalf of CiTechNew: Manage All Your Stock Portfolios in One Place
We've created the ultimate portfolio companion for stock investors, and it's free.
• Connect an unlimited number of Portfolios and see your total in one currency
• Be alerted to new Warning Signs or Risks via email or mobile
• Track the Fair Value of your stocks
Have feedback on this article? Concerned about the content? Get in touch with us directly. Alternatively, email editorial-team (at) simplywallst.com.
This article by Simply Wall St is general in nature. We provide commentary based on historical data and analyst forecasts only using an unbiased methodology and our articles are not intended to be financial advice. It does not constitute a recommendation to buy or sell any stock, and does not take account of your objectives, or your financial situation. We aim to bring you long-term focused analysis driven by fundamental data. Note that our analysis may not factor in the latest price-sensitive company announcements or qualitative material. Simply Wall St has no position in any stocks mentioned.
About TSX:PIF
Polaris Renewable Energy
Engages in the acquisition, exploration, development, and operation of renewable energy projects in Latin America and the Caribbean.
Undervalued established dividend payer.
Similar Companies
Market Insights

Weekly Picks

Early mover in a fast growing industry. Likely to experience share price volatility as they scale


A case for CA$31.80 (undiluted), aka 8,616% upside from CA$0.37 (an 86 bagger!).


Moderation and Stabilisation: HOLD: Fair Price based on a 4-year Cycle is $12.08
Recently Updated Narratives


Title: Market Sentiment Is Dead Wrong — Here's Why PSEC Deserves a Second Look


An amazing opportunity to potentially get a 100 bagger

Amazon: Why the World’s Biggest Platform Still Runs on Invisible Economics
Popular Narratives


Crazy Undervalued 42 Baggers Silver Play (Active & Running Mine)


MicroVision will explode future revenue by 380.37% with a vision towards success


NVDA: Expanding AI Demand Will Drive Major Data Center Investments Through 2026
Trending Discussion
