
Advertisement
- Canada
- /
- Other Utilities
- /
- TSX:ACO.X
Is ATCO Ltd.'s (TSE:ACO.X) 8.2% ROE Strong Compared To Its Industry?
While some investors are already well versed in financial metrics (hat tip), this article is for those who would like to learn about Return On Equity (ROE) and why it is important. We'll use ROE to examine ATCO Ltd. (TSE:ACO.X), by way of a worked example.
Return on equity or ROE is a key measure used to assess how efficiently a company's management is utilizing the company's capital. Simply put, it is used to assess the profitability of a company in relation to its equity capital.
Our free stock report includes 1 warning sign investors should be aware of before investing in ATCO. Read for free now.How Do You Calculate Return On Equity?
The formula for return on equity is:
Return on Equity = Net Profit (from continuing operations) ÷ Shareholders' Equity
So, based on the above formula, the ROE for ATCO is:
8.2% = CA$711m ÷ CA$8.7b (Based on the trailing twelve months to December 2024).
The 'return' refers to a company's earnings over the last year. That means that for every CA$1 worth of shareholders' equity, the company generated CA$0.08 in profit.
View our latest analysis for ATCO
Does ATCO Have A Good Return On Equity?
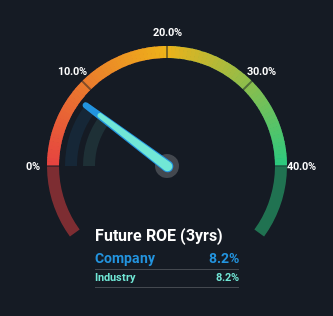
By comparing a company's ROE with its industry average, we can get a quick measure of how good it is. The limitation of this approach is that some companies are quite different from others, even within the same industry classification. The image below shows that ATCO has an ROE that is roughly in line with the Integrated Utilities industry average (8.2%).
So while the ROE is not exceptional, at least its acceptable. Although the ROE is similar to the industry, we should still perform further checks to see if the company's ROE is being boosted by high debt levels. If a company takes on too much debt, it is at higher risk of defaulting on interest payments.
The Importance Of Debt To Return On Equity
Virtually all companies need money to invest in the business, to grow profits. The cash for investment can come from prior year profits (retained earnings), issuing new shares, or borrowing. In the first and second cases, the ROE will reflect this use of cash for investment in the business. In the latter case, the use of debt will improve the returns, but will not change the equity. That will make the ROE look better than if no debt was used.
ATCO's Debt And Its 8.2% ROE
ATCO does use a high amount of debt to increase returns. It has a debt to equity ratio of 1.36. Its ROE is quite low, even with the use of significant debt; that's not a good result, in our opinion. Debt increases risk and reduces options for the company in the future, so you generally want to see some good returns from using it.
Summary
Return on equity is useful for comparing the quality of different businesses. Companies that can achieve high returns on equity without too much debt are generally of good quality. If two companies have the same ROE, then I would generally prefer the one with less debt.
But when a business is high quality, the market often bids it up to a price that reflects this. Profit growth rates, versus the expectations reflected in the price of the stock, are a particularly important to consider. So you might want to take a peek at this data-rich interactive graph of forecasts for the company.
Of course ATCO may not be the best stock to buy. So you may wish to see this free collection of other companies that have high ROE and low debt.
New: Manage All Your Stock Portfolios in One Place
We've created the ultimate portfolio companion for stock investors, and it's free.
• Connect an unlimited number of Portfolios and see your total in one currency
• Be alerted to new Warning Signs or Risks via email or mobile
• Track the Fair Value of your stocks
Have feedback on this article? Concerned about the content? Get in touch with us directly. Alternatively, email editorial-team (at) simplywallst.com.
This article by Simply Wall St is general in nature. We provide commentary based on historical data and analyst forecasts only using an unbiased methodology and our articles are not intended to be financial advice. It does not constitute a recommendation to buy or sell any stock, and does not take account of your objectives, or your financial situation. We aim to bring you long-term focused analysis driven by fundamental data. Note that our analysis may not factor in the latest price-sensitive company announcements or qualitative material. Simply Wall St has no position in any stocks mentioned.
About TSX:ACO.X
ATCO
Engages in the energy, logistics and transportation, shelter, and real estate services in Canada, Australia, and internationally.
Undervalued established dividend payer.
Similar Companies
Market Insights

Advertisement
Community Narratives
MicroVision will explode future revenue by 380.37% with a vision towards success
Fair Value US$60|98.4% undervalued
TH
Community Contributor
The Indispensable Artery for a New North American Economy
Fair Value CA$132.87|1.6% undervalued
TI
Community Contributor
Recently Updated Narratives
BE


Bejgal on MINISO Group Holding ·
MINISO's fair value is projected at 26.69 with an anticipated PE ratio shift of 20x
Fair Value:US$26.6928.0% undervalued
44 followersusers have followed this narrative
3 commentsusers have commented on this narrative
0 likesusers have liked this narrative
TI


TickerTickle on Oracle ·
The Quiet Giant That Became AI’s Power Grid
Fair Value:US$389.8149.5% undervalued
7 followersusers have followed this narrative
1 commentusers have commented on this narrative
0 likesusers have liked this narrative
AU

AuCA on Nova Ljubljanska Banka d.d ·
Nova Ljubljanska Banka d.d will expect a 11.2% revenue boost driving future growth
Fair Value:€20916.3% undervalued
23 followersusers have followed this narrative
3 commentsusers have commented on this narrative
0 likesusers have liked this narrative
Popular Narratives
OS


oscargarcia on Alphabet ·
The company that turned a verb into a global necessity and basically runs the modern internet, digital ads, smartphones, maps, and AI.
Fair Value:US$3404.9% undervalued
134 followersusers have followed this narrative
6 commentsusers have commented on this narrative
18 likesusers have liked this narrative
TH

TheWallstreetKing on MicroVision ·
MicroVision will explode future revenue by 380.37% with a vision towards success
Fair Value:US$6098.4% undervalued
83 followersusers have followed this narrative
11 commentsusers have commented on this narrative
18 likesusers have liked this narrative
AN


AnalystConsensusTarget on NVIDIA ·
NVDA: Expanding AI Demand Will Drive Major Data Center Investments Through 2026
Fair Value:US$232.7923.6% undervalued
923 followersusers have followed this narrative
5 commentsusers have commented on this narrative
22 likesusers have liked this narrative