Advertisement
- Canada
- /
- Transportation
- /
- TSX:TFII
Could Recent 35.7% Drop Signal an Opportunity in TFI International Stock?

Simply Wall St
Reviewed by Bailey Pemberton
- Wondering if TFI International is offering genuine value, or if there’s more to the story just below the surface? You’re not alone, and now is a great time to dig into what’s really driving its price.
- The stock has seen notable movement lately, from a five-year gain of nearly 110% to a sharp 35.7% year-to-date drop, shifting both growth optimism and risk perceptions.
- Pressure on the broader transport sector and evolving freight market trends have weighed on the share price, as investors react to headlines around capacity challenges and shifting demand. Regulatory changes and consolidation news have also put TFI International in the spotlight, stirring up conversations about the company’s long-term prospects.
- On our valuation checks, TFI International scores 3 out of 6 for being undervalued. There is clearly nuance to unpack. Let’s walk through the approaches investors use to figure out fair value, and stay tuned for a perspective on valuation that goes even deeper by the end of this article.
Find out why TFI International's -33.2% return over the last year is lagging behind its peers.
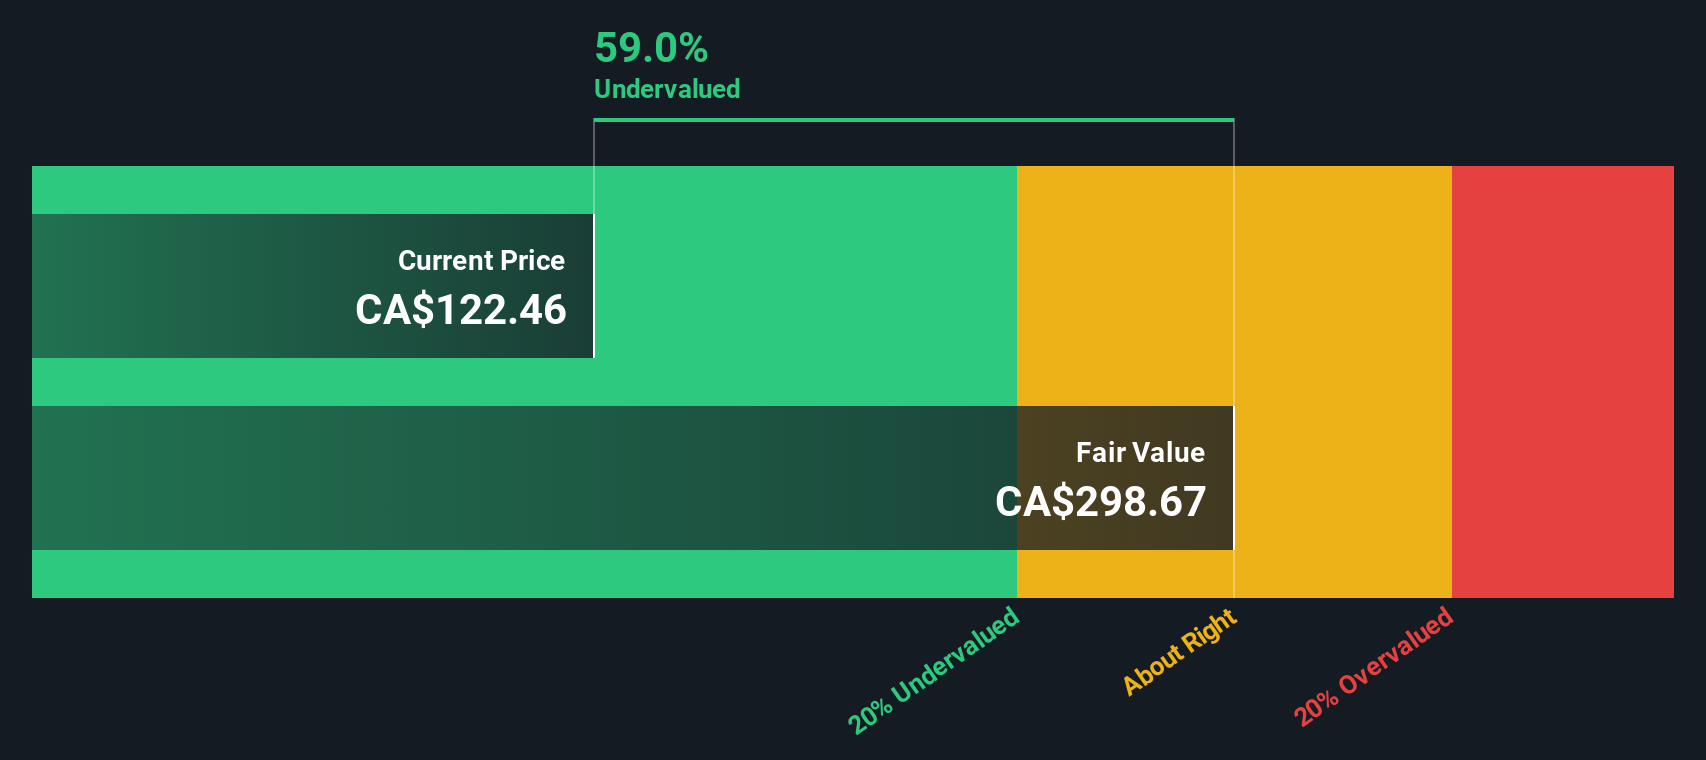
Approach 1: TFI International Discounted Cash Flow (DCF) Analysis
A Discounted Cash Flow (DCF) model estimates a company's intrinsic value by forecasting its expected future cash flows and then discounting those back to today's dollars. This approach helps investors determine whether a stock is currently trading at a bargain or a premium.
For TFI International, the most recent Free Cash Flow (FCF) is $684.2 million. Analysts project steady FCF growth, reaching $991 million by 2029. Beyond that, future cash flows are extrapolated, but estimates are less certain. These figures capture how the company's underlying business is expected to evolve and generate cash over time.
Using a 2 Stage Free Cash Flow to Equity model, the estimated intrinsic value per share is $304.22. This represents a significant 59.9% discount compared to the stock's current price. This suggests TFI International is undervalued under this methodology.
Result: UNDERVALUED
Our Discounted Cash Flow (DCF) analysis suggests TFI International is undervalued by 59.9%. Track this in your watchlist or portfolio, or discover 834 more undervalued stocks based on cash flows.
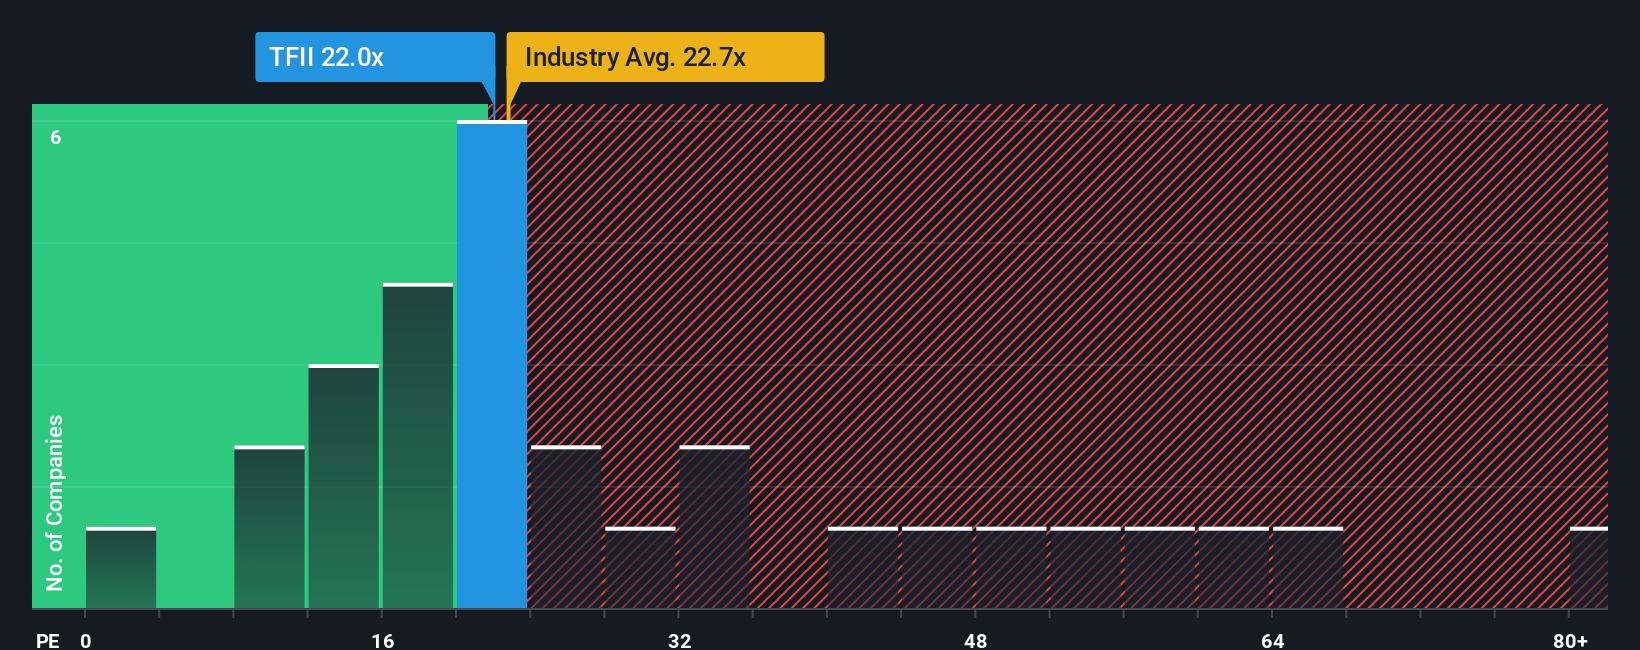
Approach 2: TFI International Price vs Earnings
The Price-to-Earnings (PE) ratio is widely used to assess the valuation of profitable companies because it relates a company’s share price to its earnings per share. For investors, a PE ratio provides a quick way to gauge whether a stock is expensive or cheap relative to its profits.
However, not all PE ratios are created equal. Growth expectations and perceived risk play a big role in what is considered a “normal” or fair multiple. Companies with higher expected earnings growth, stronger profitability, or lower risk typically warrant a higher PE ratio, while slower growth or higher risk drives the benchmark down.
Currently, TFI International trades at 19.7x earnings. This is above the Transportation industry average PE of 15.5x as well as its peer group average of 16.2x. At first glance, this could suggest the stock is trading at a premium to both its sector and direct competitors.
Simply Wall St’s proprietary Fair Ratio for TFI International is 15.7x. Unlike traditional comparisons, the Fair Ratio incorporates factors like the company’s earnings growth outlook, risk profile, profit margins, and market capitalization. This makes it a more tailored and informative benchmark than industry or peer averages.
TFI International’s PE is slightly above its Fair Ratio, implying the stock is trading a bit higher than what would be justified by its fundamentals. However, with a difference of less than 0.1x, the valuation is essentially in line with what investors should expect.
Result: ABOUT RIGHT
PE ratios tell one story, but what if the real opportunity lies elsewhere? Discover 1408 companies where insiders are betting big on explosive growth.
Upgrade Your Decision Making: Choose your TFI International Narrative
Earlier we mentioned that there's an even better way to understand valuation, so let's introduce you to Narratives. A Narrative is simply your view of a company's story combined with your forecast for its financials, such as estimated future revenues, earnings, and margins, to arrive at your own Fair Value for the stock.
Rather than relying purely on analyst consensus or traditional metrics, Narratives let you map your perspective about TFI International’s opportunities and risks directly to your valuation. This links the “why” behind the numbers to what you believe the company is really worth.
On Simply Wall St’s Community page, investors of all experience levels can easily create and share their own Narratives. Millions already use this to test what would make TFI International a buy or sell for them by comparing their Fair Value against the current share price. Every Narrative updates automatically as new results or news emerges.
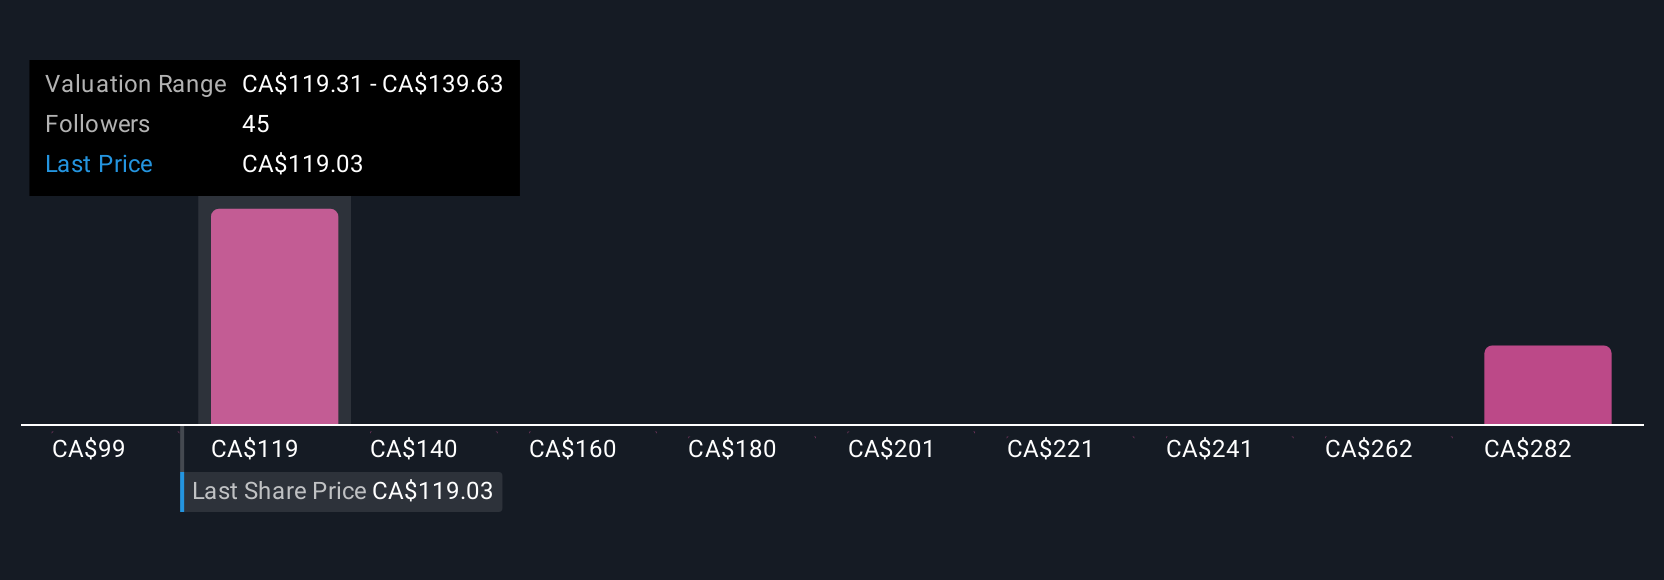
For TFI International, Narratives span from bullish price targets above CA$170, picturing accelerating cross-border growth and greater efficiency, to more cautious views as low as CA$96.67, emphasizing industry headwinds and persistent weak demand. This demonstrates just how much perspectives and decisions can vary depending on your interpretation of the story behind the numbers.
Do you think there's more to the story for TFI International? Head over to our Community to see what others are saying!
This article by Simply Wall St is general in nature. We provide commentary based on historical data and analyst forecasts only using an unbiased methodology and our articles are not intended to be financial advice. It does not constitute a recommendation to buy or sell any stock, and does not take account of your objectives, or your financial situation. We aim to bring you long-term focused analysis driven by fundamental data. Note that our analysis may not factor in the latest price-sensitive company announcements or qualitative material. Simply Wall St has no position in any stocks mentioned.
Valuation is complex, but we're here to simplify it.
Discover if TFI International might be undervalued or overvalued with our detailed analysis, featuring fair value estimates, potential risks, dividends, insider trades, and its financial condition.
Access Free AnalysisHave feedback on this article? Concerned about the content? Get in touch with us directly. Alternatively, email editorial-team@simplywallst.com
About TSX:TFII
TFI International
Provides transportation and logistics services in the United States, Mexico, and Canada.
Average dividend payer and fair value.
Similar Companies
Market Insights

Advertisement
Community Narratives
The company that turned a verb into a global necessity and basically runs the modern internet, digital ads, smartphones, maps, and AI.
Fair Value US$300.00|6.2% undervalued
OS
Community Contributor
Flowers Foods Pays A Fair Price For Health
Fair Value US$16.12|26.0% undervalued
NV
Community Contributor
TMX Group will thrive with 33.3% profit margin and enduring market moat
Fair Value CA$49.90|3.7% overvalued
LI
Community Contributor