3 TSX Stocks Trading Up To 48.2% Below Intrinsic Value Estimates

Reviewed by Simply Wall St

The Canadian stock market has experienced notable volatility recently, with significant daily swings and modest overall changes despite dramatic headlines. Amid this turbulence, identifying undervalued stocks can offer investors opportunities to benefit from potential rebounds.
Top 10 Undervalued Stocks Based On Cash Flows In Canada
| Name | Current Price | Fair Value (Est) | Discount (Est) |
| goeasy (TSX:GSY) | CA$185.46 | CA$357.89 | 48.2% |
| Alvopetro Energy (TSXV:ALV) | CA$4.97 | CA$9.19 | 45.9% |
| Computer Modelling Group (TSX:CMG) | CA$13.01 | CA$22.31 | 41.7% |
| Kinaxis (TSX:KXS) | CA$149.14 | CA$285.76 | 47.8% |
| Obsidian Energy (TSX:OBE) | CA$9.32 | CA$17.94 | 48.1% |
| Viemed Healthcare (TSX:VMD) | CA$10.45 | CA$20.08 | 48% |
| Kraken Robotics (TSXV:PNG) | CA$1.33 | CA$2.54 | 47.6% |
| Constellation Software (TSX:CSU) | CA$3959.54 | CA$7176.99 | 44.8% |
| NanoXplore (TSX:GRA) | CA$2.28 | CA$4.22 | 46% |
| TerrAscend (TSX:TSND) | CA$1.96 | CA$3.58 | 45.2% |
Let's explore several standout options from the results in the screener.
Calian Group (TSX:CGY)
Overview: Calian Group Ltd., with a market cap of CA$542.33 million, provides business services and solutions in Canada and internationally.
Operations: The company's revenue segments include ITCS (CA$215.64 million), Health (CA$211.36 million), Learning (CA$106.89 million), and Advanced Technologies (CA$207.51 million).
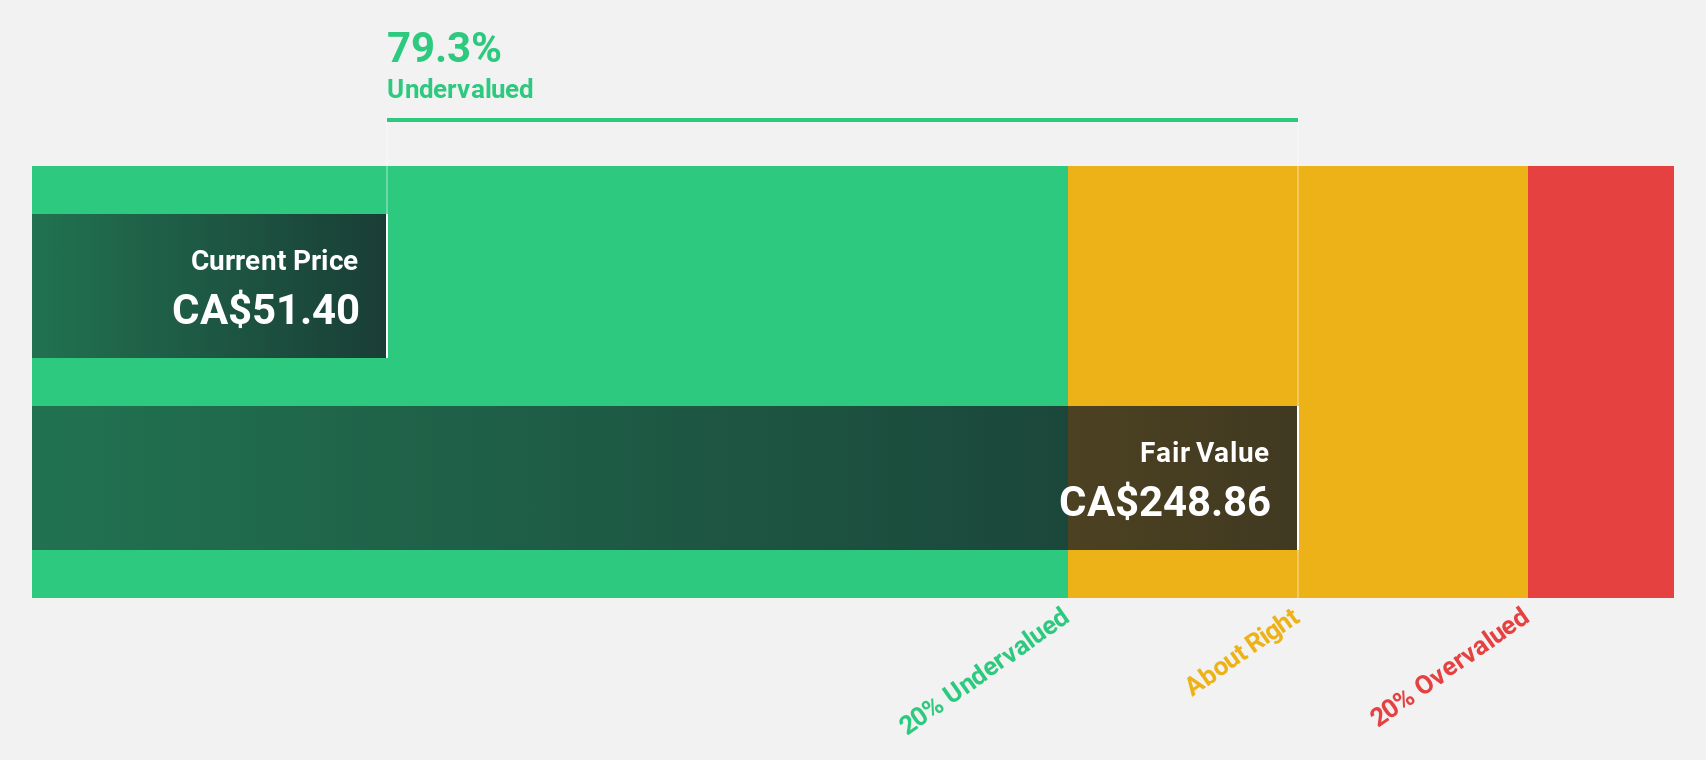
Estimated Discount To Fair Value: 35.9%
Calian Group's earnings are forecast to grow 35.81% annually, significantly outpacing the Canadian market's 14.8%. Despite recent one-off items impacting financial results, Calian is trading at CA$47.05, well below its estimated fair value of CA$73.4, indicating it is highly undervalued based on discounted cash flow analysis. Recent earnings showed a decline in net income but an increase in sales, and the company reaffirmed revenue guidance between $750 million and $810 million for fiscal 2024.
- Our growth report here indicates Calian Group may be poised for an improving outlook.
- Dive into the specifics of Calian Group here with our thorough financial health report.
Exchange Income (TSX:EIF)
Overview: Exchange Income Corporation, with a market cap of CA$2.20 billion, operates globally through its subsidiaries in aerospace and aviation services and equipment, as well as manufacturing businesses.
Operations: Revenue Segments (in millions of CA$): Exchange Income Corporation generates revenue through its aerospace and aviation services and equipment, as well as its manufacturing businesses.
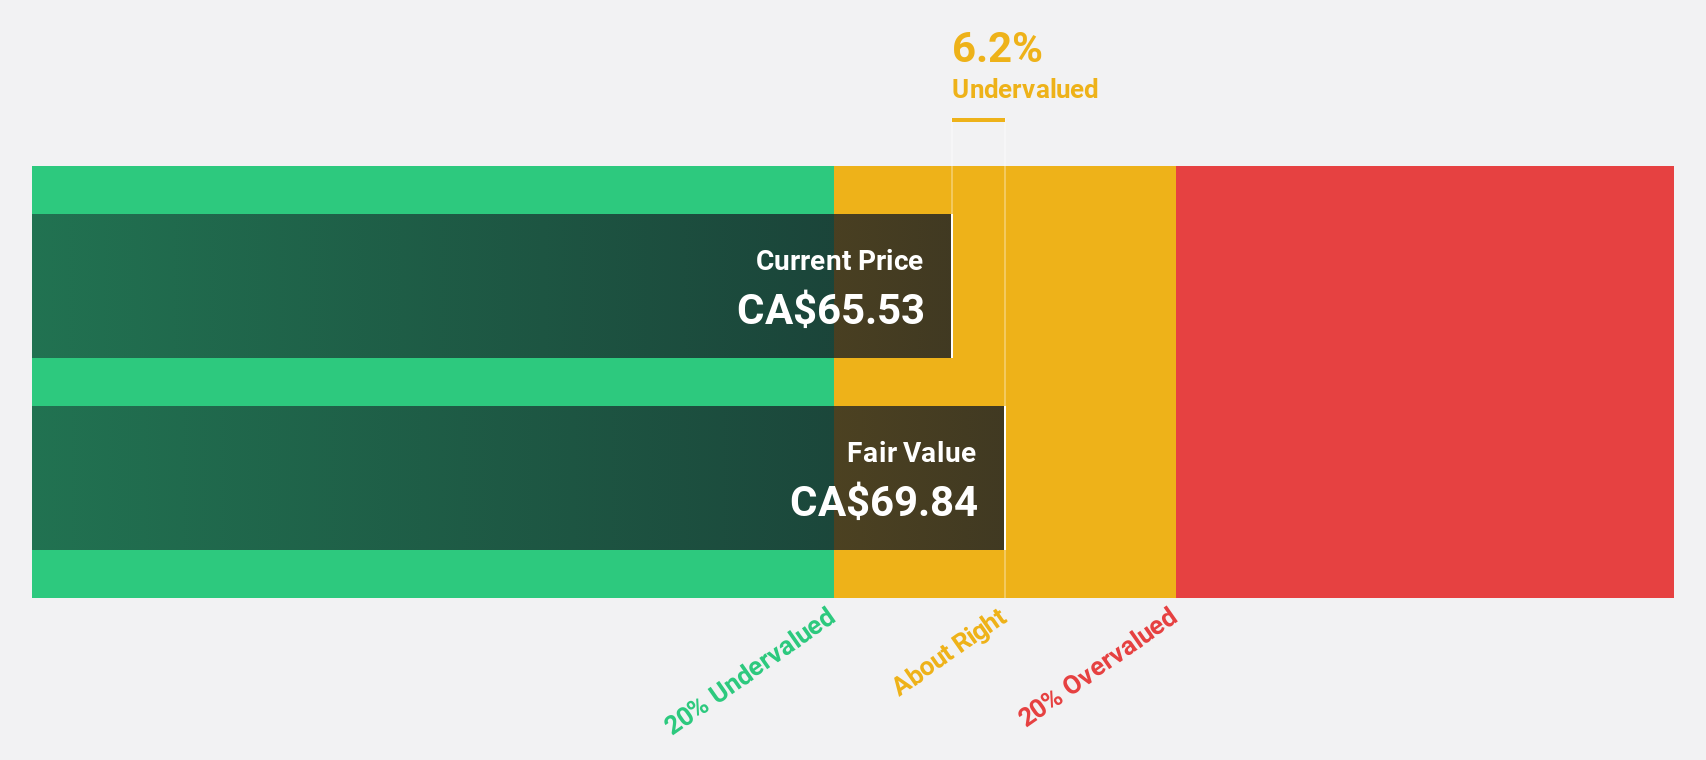
Estimated Discount To Fair Value: 16.1%
Exchange Income Corporation (EIF) is trading at CA$46.75, 16.1% below its estimated fair value of CA$55.73, indicating it is undervalued based on discounted cash flow analysis. Despite a dividend yield of 5.65%, the dividend isn't well covered by earnings or free cash flows, and interest payments are not well covered by earnings either. Recent earnings showed increased sales but a decline in net income and diluted EPS compared to last year, suggesting some financial pressures remain despite growth prospects.
- The analysis detailed in our Exchange Income growth report hints at robust future financial performance.
- Click here to discover the nuances of Exchange Income with our detailed financial health report.
goeasy (TSX:GSY)
Overview: goeasy Ltd. offers non-prime leasing and lending services through its easyhome, easyfinancial, and LendCare brands to consumers in Canada, with a market cap of CA$3.15 billion.
Operations: The company's revenue segments include CA$323.12 million from easyhome, CA$1.13 billion from easyfinancial, and CA$91.78 million from LendCare brands.
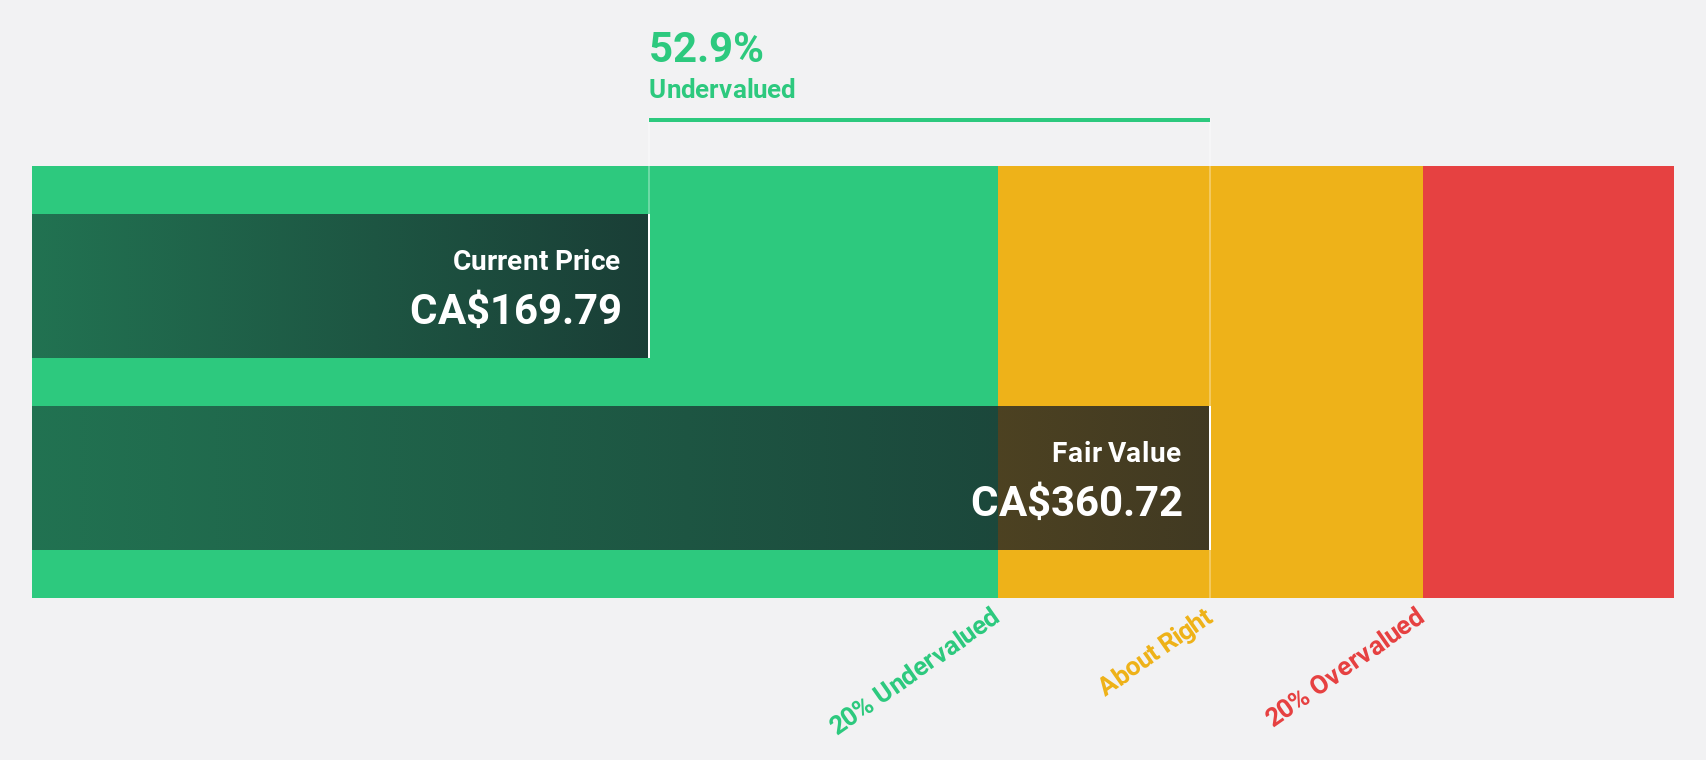
Estimated Discount To Fair Value: 48.2%
goeasy Ltd. is trading at CA$185.46, significantly below its estimated fair value of CA$357.89, suggesting it is undervalued based on discounted cash flow analysis. Revenue growth is forecasted to outpace the Canadian market at 31.9% per year, though earnings growth at 17.1% per year isn't as high as some might expect for such a discrepancy in valuation. Recent earnings showed strong performance with net income increasing to CA$65.4 million from CA$55.55 million a year ago, despite substantial insider selling over the past quarter and debt not being well covered by operating cash flow.
- Upon reviewing our latest growth report, goeasy's projected financial performance appears quite optimistic.
- Unlock comprehensive insights into our analysis of goeasy stock in this financial health report.
Next Steps
- Navigate through the entire inventory of 31 Undervalued TSX Stocks Based On Cash Flows here.
- Are these companies part of your investment strategy? Use Simply Wall St to consolidate your holdings into a portfolio and gain insights with our comprehensive analysis tools.
- Take control of your financial future using Simply Wall St, offering free, in-depth knowledge of international markets to every investor.
Contemplating Other Strategies?
- Explore high-performing small cap companies that haven't yet garnered significant analyst attention.
- Diversify your portfolio with solid dividend payers offering reliable income streams to weather potential market turbulence.
- Fuel your portfolio with companies showing strong growth potential, backed by optimistic outlooks both from analysts and management.
This article by Simply Wall St is general in nature. We provide commentary based on historical data and analyst forecasts only using an unbiased methodology and our articles are not intended to be financial advice. It does not constitute a recommendation to buy or sell any stock, and does not take account of your objectives, or your financial situation. We aim to bring you long-term focused analysis driven by fundamental data. Note that our analysis may not factor in the latest price-sensitive company announcements or qualitative material. Simply Wall St has no position in any stocks mentioned.
Valuation is complex, but we're here to simplify it.
Discover if Exchange Income might be undervalued or overvalued with our detailed analysis, featuring fair value estimates, potential risks, dividends, insider trades, and its financial condition.
Access Free AnalysisHave feedback on this article? Concerned about the content? Get in touch with us directly. Alternatively, email editorial-team@simplywallst.com
About TSX:EIF
Exchange Income
Engages in aerospace and aviation services and equipment, and manufacturing businesses worldwide.
Fair value with moderate growth potential.

