
Advertisement
Wishpond Technologies Ltd. (CVE:WISH) Stock's 28% Dive Might Signal An Opportunity But It Requires Some Scrutiny
Wishpond Technologies Ltd. (CVE:WISH) shareholders won't be pleased to see that the share price has had a very rough month, dropping 28% and undoing the prior period's positive performance. Instead of being rewarded, shareholders who have already held through the last twelve months are now sitting on a 30% share price drop.
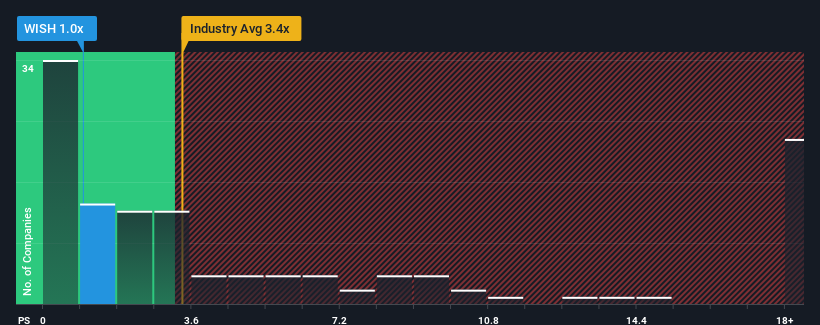
Following the heavy fall in price, Wishpond Technologies may be sending very bullish signals at the moment with its price-to-sales (or "P/S") ratio of 1x, since almost half of all companies in the Software industry in Canada have P/S ratios greater than 3.4x and even P/S higher than 10x are not unusual. Nonetheless, we'd need to dig a little deeper to determine if there is a rational basis for the highly reduced P/S.
See our latest analysis for Wishpond Technologies
How Wishpond Technologies Has Been Performing
With revenue growth that's inferior to most other companies of late, Wishpond Technologies has been relatively sluggish. Perhaps the market is expecting the current trend of poor revenue growth to continue, which has kept the P/S suppressed. If this is the case, then existing shareholders will probably struggle to get excited about the future direction of the share price.
Want the full picture on analyst estimates for the company? Then our free report on Wishpond Technologies will help you uncover what's on the horizon.What Are Revenue Growth Metrics Telling Us About The Low P/S?
In order to justify its P/S ratio, Wishpond Technologies would need to produce anemic growth that's substantially trailing the industry.
Retrospectively, the last year delivered a decent 6.8% gain to the company's revenues. The latest three year period has also seen an excellent 158% overall rise in revenue, aided somewhat by its short-term performance. Therefore, it's fair to say the revenue growth recently has been superb for the company.
Shifting to the future, estimates from the six analysts covering the company suggest revenue should grow by 19% each year over the next three years. That's shaping up to be similar to the 18% per annum growth forecast for the broader industry.
With this information, we find it odd that Wishpond Technologies is trading at a P/S lower than the industry. It may be that most investors are not convinced the company can achieve future growth expectations.
The Final Word
Shares in Wishpond Technologies have plummeted and its P/S has followed suit. While the price-to-sales ratio shouldn't be the defining factor in whether you buy a stock or not, it's quite a capable barometer of revenue expectations.
It looks to us like the P/S figures for Wishpond Technologies remain low despite growth that is expected to be in line with other companies in the industry. When we see middle-of-the-road revenue growth like this, we assume it must be the potential risks that are what is placing pressure on the P/S ratio. It appears some are indeed anticipating revenue instability, because these conditions should normally provide more support to the share price.
Having said that, be aware Wishpond Technologies is showing 2 warning signs in our investment analysis, you should know about.
Of course, profitable companies with a history of great earnings growth are generally safer bets. So you may wish to see this free collection of other companies that have reasonable P/E ratios and have grown earnings strongly.
Valuation is complex, but we're here to simplify it.
Discover if Wishpond Technologies might be undervalued or overvalued with our detailed analysis, featuring fair value estimates, potential risks, dividends, insider trades, and its financial condition.
Access Free AnalysisHave feedback on this article? Concerned about the content? Get in touch with us directly. Alternatively, email editorial-team (at) simplywallst.com.
This article by Simply Wall St is general in nature. We provide commentary based on historical data and analyst forecasts only using an unbiased methodology and our articles are not intended to be financial advice. It does not constitute a recommendation to buy or sell any stock, and does not take account of your objectives, or your financial situation. We aim to bring you long-term focused analysis driven by fundamental data. Note that our analysis may not factor in the latest price-sensitive company announcements or qualitative material. Simply Wall St has no position in any stocks mentioned.
About TSXV:WISH
Wishpond Technologies
Provides marketing focused online business solutions in the United States, Canada, and internationally.
Fair value with mediocre balance sheet.
Similar Companies
Market Insights

Advertisement
Community Narratives
MicroVision will explode future revenue by 380.37% with a vision towards success
Fair Value US$60.00|98.5% undervalued
TH
Community Contributor
The Indispensable Artery for a New North American Economy
Fair Value CA$132.87|2.3% undervalued
TI
Community Contributor