Positive Sentiment Still Eludes Wishpond Technologies Ltd. (CVE:WISH) Following 26% Share Price Slump
To the annoyance of some shareholders, Wishpond Technologies Ltd. (CVE:WISH) shares are down a considerable 26% in the last month, which continues a horrid run for the company. Instead of being rewarded, shareholders who have already held through the last twelve months are now sitting on a 49% share price drop.
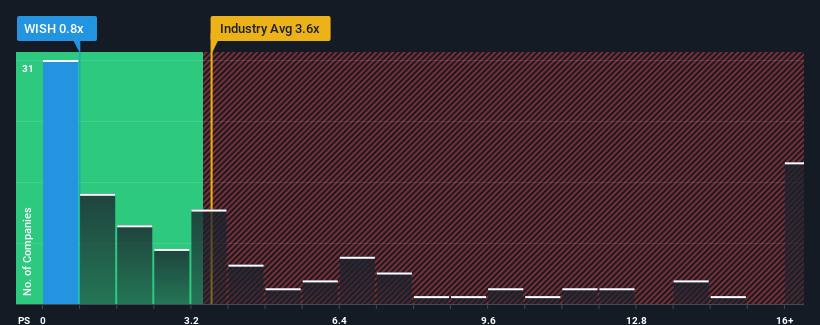
Following the heavy fall in price, Wishpond Technologies may be sending very bullish signals at the moment with its price-to-sales (or "P/S") ratio of 0.8x, since almost half of all companies in the Software industry in Canada have P/S ratios greater than 3.6x and even P/S higher than 8x are not unusual. Nonetheless, we'd need to dig a little deeper to determine if there is a rational basis for the highly reduced P/S.
View our latest analysis for Wishpond Technologies

How Wishpond Technologies Has Been Performing
With revenue growth that's inferior to most other companies of late, Wishpond Technologies has been relatively sluggish. Perhaps the market is expecting the current trend of poor revenue growth to continue, which has kept the P/S suppressed. If you still like the company, you'd be hoping revenue doesn't get any worse and that you could pick up some stock while it's out of favour.
If you'd like to see what analysts are forecasting going forward, you should check out our free report on Wishpond Technologies.Do Revenue Forecasts Match The Low P/S Ratio?
There's an inherent assumption that a company should far underperform the industry for P/S ratios like Wishpond Technologies' to be considered reasonable.
If we review the last year of revenue growth, the company posted a worthy increase of 6.8%. The latest three year period has also seen an excellent 158% overall rise in revenue, aided somewhat by its short-term performance. Accordingly, shareholders would have definitely welcomed those medium-term rates of revenue growth.
Turning to the outlook, the next three years should generate growth of 19% per annum as estimated by the five analysts watching the company. With the industry predicted to deliver 19% growth each year, the company is positioned for a comparable revenue result.
With this in consideration, we find it intriguing that Wishpond Technologies' P/S is lagging behind its industry peers. Apparently some shareholders are doubtful of the forecasts and have been accepting lower selling prices.
The Bottom Line On Wishpond Technologies' P/S
Having almost fallen off a cliff, Wishpond Technologies' share price has pulled its P/S way down as well. It's argued the price-to-sales ratio is an inferior measure of value within certain industries, but it can be a powerful business sentiment indicator.
Our examination of Wishpond Technologies' revealed that its P/S remains low despite analyst forecasts of revenue growth matching the wider industry. Despite average revenue growth estimates, there could be some unobserved threats keeping the P/S low. However, if you agree with the analysts' forecasts, you may be able to pick up the stock at an attractive price.
You should always think about risks. Case in point, we've spotted 2 warning signs for Wishpond Technologies you should be aware of.
It's important to make sure you look for a great company, not just the first idea you come across. So if growing profitability aligns with your idea of a great company, take a peek at this free list of interesting companies with strong recent earnings growth (and a low P/E).
Valuation is complex, but we're here to simplify it.
Discover if Wishpond Technologies might be undervalued or overvalued with our detailed analysis, featuring fair value estimates, potential risks, dividends, insider trades, and its financial condition.
Access Free AnalysisHave feedback on this article? Concerned about the content? Get in touch with us directly. Alternatively, email editorial-team (at) simplywallst.com.
This article by Simply Wall St is general in nature. We provide commentary based on historical data and analyst forecasts only using an unbiased methodology and our articles are not intended to be financial advice. It does not constitute a recommendation to buy or sell any stock, and does not take account of your objectives, or your financial situation. We aim to bring you long-term focused analysis driven by fundamental data. Note that our analysis may not factor in the latest price-sensitive company announcements or qualitative material. Simply Wall St has no position in any stocks mentioned.
Have feedback on this article? Concerned about the content? Get in touch with us directly. Alternatively, email editorial-team@simplywallst.com
About TSXV:WISH
Wishpond Technologies
Provides marketing focused online business solutions in the United States, Canada, and internationally.
Fair value with mediocre balance sheet.
Similar Companies
Market Insights
Community Narratives


