NowVertical Group Inc. (CVE:NOW) Might Not Be As Mispriced As It Looks After Plunging 27%

NowVertical Group Inc. (CVE:NOW) shares have had a horrible month, losing 27% after a relatively good period beforehand. Instead of being rewarded, shareholders who have already held through the last twelve months are now sitting on a 40% share price drop.
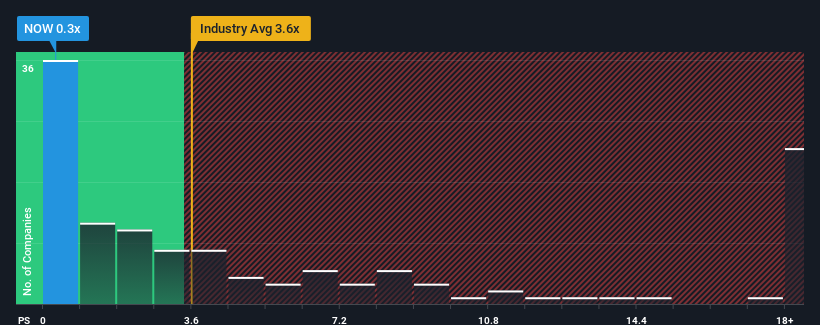
After such a large drop in price, NowVertical Group may look like a strong buying opportunity at present with its price-to-sales (or "P/S") ratio of 0.3x, considering almost half of all companies in the Software industry in Canada have P/S ratios greater than 3.6x and even P/S higher than 10x aren't out of the ordinary. Nonetheless, we'd need to dig a little deeper to determine if there is a rational basis for the highly reduced P/S.
View our latest analysis for NowVertical Group
How Has NowVertical Group Performed Recently?
Recent times have been advantageous for NowVertical Group as its revenues have been rising faster than most other companies. Perhaps the market is expecting future revenue performance to dive, which has kept the P/S suppressed. If the company manages to stay the course, then investors should be rewarded with a share price that matches its revenue figures.
If you'd like to see what analysts are forecasting going forward, you should check out our free report on NowVertical Group.How Is NowVertical Group's Revenue Growth Trending?
The only time you'd be truly comfortable seeing a P/S as depressed as NowVertical Group's is when the company's growth is on track to lag the industry decidedly.
If we review the last year of revenue growth, the company posted a terrific increase of 173%. This great performance means it was also able to deliver immense revenue growth over the last three years. Accordingly, shareholders would have been over the moon with those medium-term rates of revenue growth.
Turning to the outlook, the next three years should generate growth of 16% per year as estimated by the dual analysts watching the company. Meanwhile, the rest of the industry is forecast to expand by 16% each year, which is not materially different.
With this in consideration, we find it intriguing that NowVertical Group's P/S is lagging behind its industry peers. It may be that most investors are not convinced the company can achieve future growth expectations.
The Final Word
Having almost fallen off a cliff, NowVertical Group's share price has pulled its P/S way down as well. We'd say the price-to-sales ratio's power isn't primarily as a valuation instrument but rather to gauge current investor sentiment and future expectations.
It looks to us like the P/S figures for NowVertical Group remain low despite growth that is expected to be in line with other companies in the industry. The low P/S could be an indication that the revenue growth estimates are being questioned by the market. It appears some are indeed anticipating revenue instability, because these conditions should normally provide more support to the share price.
Having said that, be aware NowVertical Group is showing 3 warning signs in our investment analysis, you should know about.
It's important to make sure you look for a great company, not just the first idea you come across. So if growing profitability aligns with your idea of a great company, take a peek at this free list of interesting companies with strong recent earnings growth (and a low P/E).
The New Payments ETF Is Live on NASDAQ:
Money is moving to real-time rails, and a newly listed ETF now gives investors direct exposure. Fast settlement. Institutional custody. Simple access.
Explore how this launch could reshape portfolios
Sponsored ContentValuation is complex, but we're here to simplify it.
Discover if NowVertical Group might be undervalued or overvalued with our detailed analysis, featuring fair value estimates, potential risks, dividends, insider trades, and its financial condition.
Access Free AnalysisHave feedback on this article? Concerned about the content? Get in touch with us directly. Alternatively, email editorial-team (at) simplywallst.com.
This article by Simply Wall St is general in nature. We provide commentary based on historical data and analyst forecasts only using an unbiased methodology and our articles are not intended to be financial advice. It does not constitute a recommendation to buy or sell any stock, and does not take account of your objectives, or your financial situation. We aim to bring you long-term focused analysis driven by fundamental data. Note that our analysis may not factor in the latest price-sensitive company announcements or qualitative material. Simply Wall St has no position in any stocks mentioned.
About TSXV:NOW
NowVertical Group
Operates as a big data, analytics, and vertical intelligence company in the United States, Argentina, Brazil, Chile, the United Kingdom, and internationally.
Undervalued with imperfect balance sheet.
Market Insights

Weekly Picks

Early mover in a fast growing industry. Likely to experience share price volatility as they scale


A case for CA$31.80 (undiluted), aka 8,616% upside from CA$0.37 (an 86 bagger!).


Moderation and Stabilisation: HOLD: Fair Price based on a 4-year Cycle is $12.08
Recently Updated Narratives

Airbnb Stock: Platform Growth in a World of Saturation and Scrutiny

Adobe Stock: AI-Fueled ARR Growth Pushes Guidance Higher, But Cost Pressures Loom

Thomson Reuters Stock: When Legal Intelligence Becomes Mission-Critical Infrastructure
Popular Narratives


Crazy Undervalued 42 Baggers Silver Play (Active & Running Mine)


NVDA: Expanding AI Demand Will Drive Major Data Center Investments Through 2026

The AI Infrastructure Giant Grows Into Its Valuation
Trending Discussion


