Tecsys Inc.'s (TSE:TCS) Stock is Soaring But Financials Seem Inconsistent: Will The Uptrend Continue?

Tecsys' (TSE:TCS) stock is up by a considerable 10% over the past week. However, we wonder if the company's inconsistent financials would have any adverse impact on the current share price momentum. Specifically, we decided to study Tecsys' ROE in this article.
Return on equity or ROE is an important factor to be considered by a shareholder because it tells them how effectively their capital is being reinvested. Put another way, it reveals the company's success at turning shareholder investments into profits.
View our latest analysis for Tecsys
How Do You Calculate Return On Equity?
The formula for return on equity is:
Return on Equity = Net Profit (from continuing operations) ÷ Shareholders' Equity
So, based on the above formula, the ROE for Tecsys is:
2.8% = CA$2.0m ÷ CA$72m (Based on the trailing twelve months to January 2024).
The 'return' is the amount earned after tax over the last twelve months. Another way to think of that is that for every CA$1 worth of equity, the company was able to earn CA$0.03 in profit.
What Has ROE Got To Do With Earnings Growth?
Thus far, we have learned that ROE measures how efficiently a company is generating its profits. We now need to evaluate how much profit the company reinvests or "retains" for future growth which then gives us an idea about the growth potential of the company. Assuming all else is equal, companies that have both a higher return on equity and higher profit retention are usually the ones that have a higher growth rate when compared to companies that don't have the same features.
Tecsys' Earnings Growth And 2.8% ROE
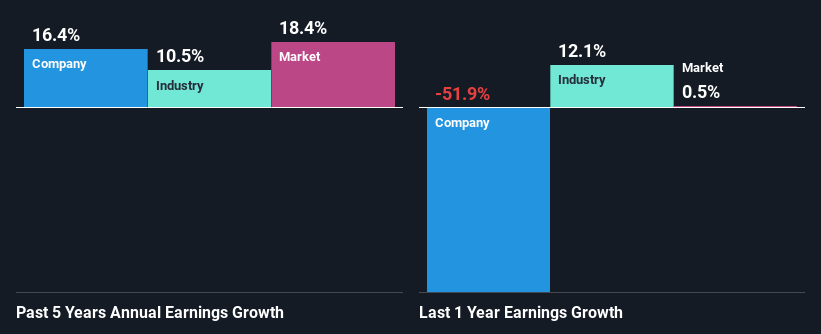
It is hard to argue that Tecsys' ROE is much good in and of itself. Even when compared to the industry average of 11%, the ROE figure is pretty disappointing. Tecsys was still able to see a decent net income growth of 16% over the past five years. We reckon that there could be other factors at play here. For example, it is possible that the company's management has made some good strategic decisions, or that the company has a low payout ratio.
As a next step, we compared Tecsys' net income growth with the industry, and pleasingly, we found that the growth seen by the company is higher than the average industry growth of 10%.
The basis for attaching value to a company is, to a great extent, tied to its earnings growth. The investor should try to establish if the expected growth or decline in earnings, whichever the case may be, is priced in. Doing so will help them establish if the stock's future looks promising or ominous. Is Tecsys fairly valued compared to other companies? These 3 valuation measures might help you decide.
Is Tecsys Making Efficient Use Of Its Profits?
The high three-year median payout ratio of 95% (or a retention ratio of 4.7%) for Tecsys suggests that the company's growth wasn't really hampered despite it returning most of its income to its shareholders.
Besides, Tecsys has been paying dividends for at least ten years or more. This shows that the company is committed to sharing profits with its shareholders.
Summary
In total, we're a bit ambivalent about Tecsys' performance. While no doubt its earnings growth is pretty substantial, its ROE and earnings retention is quite poor. So while the company has managed to grow its earnings in spite of this, we are unconvinced if this growth could extend, especially during troubled times. So far, we've only made a quick discussion around the company's earnings growth. To gain further insights into Tecsys' past profit growth, check out this visualization of past earnings, revenue and cash flows.
The New Payments ETF Is Live on NASDAQ:
Money is moving to real-time rails, and a newly listed ETF now gives investors direct exposure. Fast settlement. Institutional custody. Simple access.
Explore how this launch could reshape portfolios
Sponsored ContentValuation is complex, but we're here to simplify it.
Discover if Tecsys might be undervalued or overvalued with our detailed analysis, featuring fair value estimates, potential risks, dividends, insider trades, and its financial condition.
Access Free AnalysisHave feedback on this article? Concerned about the content? Get in touch with us directly. Alternatively, email editorial-team (at) simplywallst.com.
This article by Simply Wall St is general in nature. We provide commentary based on historical data and analyst forecasts only using an unbiased methodology and our articles are not intended to be financial advice. It does not constitute a recommendation to buy or sell any stock, and does not take account of your objectives, or your financial situation. We aim to bring you long-term focused analysis driven by fundamental data. Note that our analysis may not factor in the latest price-sensitive company announcements or qualitative material. Simply Wall St has no position in any stocks mentioned.
Have feedback on this article? Concerned about the content? Get in touch with us directly. Alternatively, email editorial-team@simplywallst.com
About TSX:TCS
Tecsys
Engages in the development, marketing, and sale of enterprise-wide supply chain management software and related services in Canada, the United States, Europe, and internationally.
Flawless balance sheet with proven track record.
Similar Companies
Market Insights

Weekly Picks

Early mover in a fast growing industry. Likely to experience share price volatility as they scale


A case for CA$31.80 (undiluted), aka 8,616% upside from CA$0.37 (an 86 bagger!).


Moderation and Stabilisation: HOLD: Fair Price based on a 4-year Cycle is $12.08
Recently Updated Narratives

Airbnb Stock: Platform Growth in a World of Saturation and Scrutiny

Adobe Stock: AI-Fueled ARR Growth Pushes Guidance Higher, But Cost Pressures Loom

Thomson Reuters Stock: When Legal Intelligence Becomes Mission-Critical Infrastructure
Popular Narratives


Crazy Undervalued 42 Baggers Silver Play (Active & Running Mine)


NVDA: Expanding AI Demand Will Drive Major Data Center Investments Through 2026

The AI Infrastructure Giant Grows Into Its Valuation
Trending Discussion


