
Advertisement
Should Weakness in Docebo Inc.'s (TSE:DCBO) Stock Be Seen As A Sign That Market Will Correct The Share Price Given Decent Financials?
It is hard to get excited after looking at Docebo's (TSE:DCBO) recent performance, when its stock has declined 9.8% over the past month. However, stock prices are usually driven by a company’s financials over the long term, which in this case look pretty respectable. Particularly, we will be paying attention to Docebo's ROE today.
Return on equity or ROE is a key measure used to assess how efficiently a company's management is utilizing the company's capital. In simpler terms, it measures the profitability of a company in relation to shareholder's equity.
Check out our latest analysis for Docebo
How To Calculate Return On Equity?
ROE can be calculated by using the formula:
Return on Equity = Net Profit (from continuing operations) ÷ Shareholders' Equity
So, based on the above formula, the ROE for Docebo is:
5.6% = US$2.8m ÷ US$51m (Based on the trailing twelve months to December 2023).
The 'return' is the profit over the last twelve months. Another way to think of that is that for every CA$1 worth of equity, the company was able to earn CA$0.06 in profit.
What Is The Relationship Between ROE And Earnings Growth?
So far, we've learned that ROE is a measure of a company's profitability. Depending on how much of these profits the company reinvests or "retains", and how effectively it does so, we are then able to assess a company’s earnings growth potential. Generally speaking, other things being equal, firms with a high return on equity and profit retention, have a higher growth rate than firms that don’t share these attributes.
Docebo's Earnings Growth And 5.6% ROE
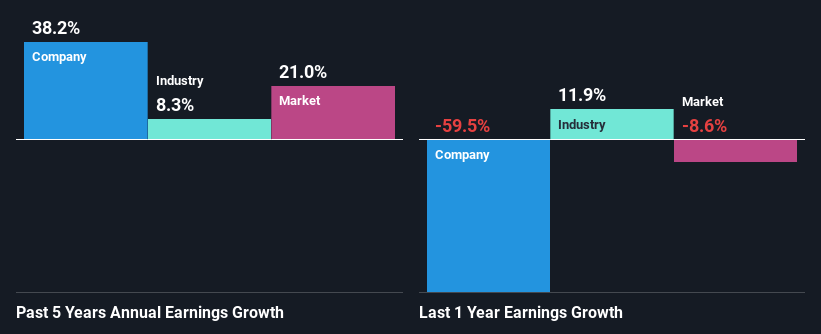
At first glance, Docebo's ROE doesn't look very promising. Next, when compared to the average industry ROE of 13%, the company's ROE leaves us feeling even less enthusiastic. Despite this, surprisingly, Docebo saw an exceptional 38% net income growth over the past five years. We reckon that there could be other factors at play here. For instance, the company has a low payout ratio or is being managed efficiently.
We then compared Docebo's net income growth with the industry and we're pleased to see that the company's growth figure is higher when compared with the industry which has a growth rate of 8.3% in the same 5-year period.
Earnings growth is a huge factor in stock valuation. The investor should try to establish if the expected growth or decline in earnings, whichever the case may be, is priced in. This then helps them determine if the stock is placed for a bright or bleak future. What is DCBO worth today? The intrinsic value infographic in our free research report helps visualize whether DCBO is currently mispriced by the market.
Is Docebo Using Its Retained Earnings Effectively?
Docebo doesn't pay any dividend to its shareholders, meaning that the company has been reinvesting all of its profits into the business. This is likely what's driving the high earnings growth number discussed above.
Conclusion
On the whole, we do feel that Docebo has some positive attributes. With a high rate of reinvestment, albeit at a low ROE, the company has managed to see a considerable growth in its earnings. With that said, the latest industry analyst forecasts reveal that the company's earnings are expected to accelerate. To know more about the latest analysts predictions for the company, check out this visualization of analyst forecasts for the company.
New: Manage All Your Stock Portfolios in One Place
We've created the ultimate portfolio companion for stock investors, and it's free.
• Connect an unlimited number of Portfolios and see your total in one currency
• Be alerted to new Warning Signs or Risks via email or mobile
• Track the Fair Value of your stocks
Have feedback on this article? Concerned about the content? Get in touch with us directly. Alternatively, email editorial-team (at) simplywallst.com.
This article by Simply Wall St is general in nature. We provide commentary based on historical data and analyst forecasts only using an unbiased methodology and our articles are not intended to be financial advice. It does not constitute a recommendation to buy or sell any stock, and does not take account of your objectives, or your financial situation. We aim to bring you long-term focused analysis driven by fundamental data. Note that our analysis may not factor in the latest price-sensitive company announcements or qualitative material. Simply Wall St has no position in any stocks mentioned.
About TSX:DCBO
Docebo
Develops and provides a learning management platform for training in North America and internationally.
Flawless balance sheet with high growth potential.
Similar Companies
Market Insights

Advertisement
Community Narratives
The company that turned a verb into a global necessity and basically runs the modern internet, digital ads, smartphones, maps, and AI.
Fair Value US$300.00|5.1% undervalued
OS
Community Contributor
Flowers Foods Pays A Fair Price For Health
Fair Value US$16.12|27.7% undervalued
NV
Community Contributor
TMX Group will thrive with 33.3% profit margin and enduring market moat
Fair Value CA$49.90|0.2% overvalued
LI
Community Contributor
The "Molecular Pencil": Why Beam's Technology is Built to Win
Fair Value US$65.01|64.4% undervalued
DA
Community Contributor