- Canada
- /
- Specialty Stores
- /
- TSXV:BILD
BuildDirect.com Technologies Inc. (CVE:BILD) Stock Rockets 38% As Investors Are Less Pessimistic Than Expected

BuildDirect.com Technologies Inc. (CVE:BILD) shares have continued their recent momentum with a 38% gain in the last month alone. The last month tops off a massive increase of 230% in the last year.
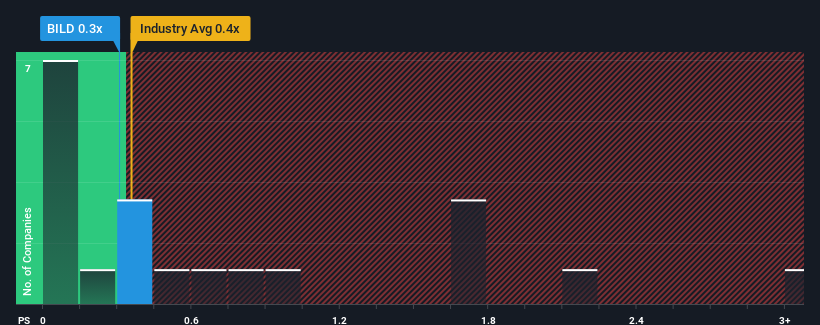
Even after such a large jump in price, there still wouldn't be many who think BuildDirect.com Technologies' price-to-sales (or "P/S") ratio of 0.3x is worth a mention when the median P/S in Canada's Specialty Retail industry is similar at about 0.6x. However, investors might be overlooking a clear opportunity or potential setback if there is no rational basis for the P/S.
See our latest analysis for BuildDirect.com Technologies
How Has BuildDirect.com Technologies Performed Recently?
While the industry has experienced revenue growth lately, BuildDirect.com Technologies' revenue has gone into reverse gear, which is not great. One possibility is that the P/S ratio is moderate because investors think this poor revenue performance will turn around. If not, then existing shareholders may be a little nervous about the viability of the share price.
Want the full picture on analyst estimates for the company? Then our free report on BuildDirect.com Technologies will help you uncover what's on the horizon.What Are Revenue Growth Metrics Telling Us About The P/S?
In order to justify its P/S ratio, BuildDirect.com Technologies would need to produce growth that's similar to the industry.
Taking a look back first, the company's revenue growth last year wasn't something to get excited about as it posted a disappointing decline of 18%. However, a few very strong years before that means that it was still able to grow revenue by an impressive 48% in total over the last three years. Although it's been a bumpy ride, it's still fair to say the revenue growth recently has been more than adequate for the company.
Turning to the outlook, the next year should bring diminished returns, with revenue decreasing 24% as estimated by the sole analyst watching the company. Meanwhile, the broader industry is forecast to expand by 8.6%, which paints a poor picture.
With this in consideration, we think it doesn't make sense that BuildDirect.com Technologies' P/S is closely matching its industry peers. Apparently many investors in the company reject the analyst cohort's pessimism and aren't willing to let go of their stock right now. There's a good chance these shareholders are setting themselves up for future disappointment if the P/S falls to levels more in line with the negative growth outlook.
The Final Word
BuildDirect.com Technologies' stock has a lot of momentum behind it lately, which has brought its P/S level with the rest of the industry. It's argued the price-to-sales ratio is an inferior measure of value within certain industries, but it can be a powerful business sentiment indicator.
It appears that BuildDirect.com Technologies currently trades on a higher than expected P/S for a company whose revenues are forecast to decline. When we see a gloomy outlook like this, our immediate thoughts are that the share price is at risk of declining, negatively impacting P/S. If we consider the revenue outlook, the P/S seems to indicate that potential investors may be paying a premium for the stock.
Having said that, be aware BuildDirect.com Technologies is showing 3 warning signs in our investment analysis, and 1 of those is potentially serious.
Of course, profitable companies with a history of great earnings growth are generally safer bets. So you may wish to see this free collection of other companies that have reasonable P/E ratios and have grown earnings strongly.
The New Payments ETF Is Live on NASDAQ:
Money is moving to real-time rails, and a newly listed ETF now gives investors direct exposure. Fast settlement. Institutional custody. Simple access.
Explore how this launch could reshape portfolios
Sponsored ContentValuation is complex, but we're here to simplify it.
Discover if BuildDirect.com Technologies might be undervalued or overvalued with our detailed analysis, featuring fair value estimates, potential risks, dividends, insider trades, and its financial condition.
Access Free AnalysisHave feedback on this article? Concerned about the content? Get in touch with us directly. Alternatively, email editorial-team (at) simplywallst.com.
This article by Simply Wall St is general in nature. We provide commentary based on historical data and analyst forecasts only using an unbiased methodology and our articles are not intended to be financial advice. It does not constitute a recommendation to buy or sell any stock, and does not take account of your objectives, or your financial situation. We aim to bring you long-term focused analysis driven by fundamental data. Note that our analysis may not factor in the latest price-sensitive company announcements or qualitative material. Simply Wall St has no position in any stocks mentioned.
About TSXV:BILD
BuildDirect.com Technologies
Operates a marketplace for purchasing and selling building materials online in the United States, Canada, and internationally.
Excellent balance sheet with minimal risk.
Similar Companies
Market Insights

Weekly Picks

Early mover in a fast growing industry. Likely to experience share price volatility as they scale


A case for CA$31.80 (undiluted), aka 8,616% upside from CA$0.37 (an 86 bagger!).


Moderation and Stabilisation: HOLD: Fair Price based on a 4-year Cycle is $12.08
Recently Updated Narratives


Title: Market Sentiment Is Dead Wrong — Here's Why PSEC Deserves a Second Look


An amazing opportunity to potentially get a 100 bagger

Amazon: Why the World’s Biggest Platform Still Runs on Invisible Economics
Popular Narratives


MicroVision will explode future revenue by 380.37% with a vision towards success


Crazy Undervalued 42 Baggers Silver Play (Active & Running Mine)


NVDA: Expanding AI Demand Will Drive Major Data Center Investments Through 2026
Trending Discussion
