
Advertisement
- Canada
- /
- Specialty Stores
- /
- TSXV:BILD
BuildDirect.com Technologies Inc. (CVE:BILD) Held Back By Insufficient Growth Even After Shares Climb 43%
The BuildDirect.com Technologies Inc. (CVE:BILD) share price has done very well over the last month, posting an excellent gain of 43%. Unfortunately, despite the strong performance over the last month, the full year gain of 9.1% isn't as attractive.
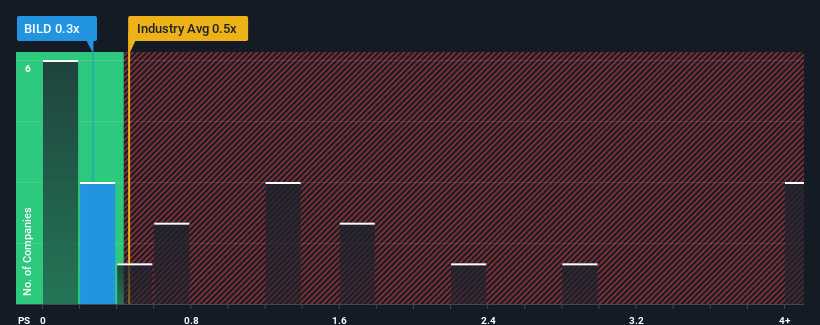
In spite of the firm bounce in price, when close to half the companies operating in Canada's Specialty Retail industry have price-to-sales ratios (or "P/S") above 1.3x, you may still consider BuildDirect.com Technologies as an enticing stock to check out with its 0.3x P/S ratio. Nonetheless, we'd need to dig a little deeper to determine if there is a rational basis for the reduced P/S.
Check out our latest analysis for BuildDirect.com Technologies
How Has BuildDirect.com Technologies Performed Recently?
For instance, BuildDirect.com Technologies' receding revenue in recent times would have to be some food for thought. Perhaps the market believes the recent revenue performance isn't good enough to keep up the industry, causing the P/S ratio to suffer. Those who are bullish on BuildDirect.com Technologies will be hoping that this isn't the case so that they can pick up the stock at a lower valuation.
Although there are no analyst estimates available for BuildDirect.com Technologies, take a look at this free data-rich visualisation to see how the company stacks up on earnings, revenue and cash flow.Do Revenue Forecasts Match The Low P/S Ratio?
BuildDirect.com Technologies' P/S ratio would be typical for a company that's only expected to deliver limited growth, and importantly, perform worse than the industry.
Retrospectively, the last year delivered a frustrating 15% decrease to the company's top line. This means it has also seen a slide in revenue over the longer-term as revenue is down 20% in total over the last three years. So unfortunately, we have to acknowledge that the company has not done a great job of growing revenue over that time.
Comparing that to the industry, which is predicted to deliver 11% growth in the next 12 months, the company's downward momentum based on recent medium-term revenue results is a sobering picture.
In light of this, it's understandable that BuildDirect.com Technologies' P/S would sit below the majority of other companies. However, we think shrinking revenues are unlikely to lead to a stable P/S over the longer term, which could set up shareholders for future disappointment. There's potential for the P/S to fall to even lower levels if the company doesn't improve its top-line growth.
What We Can Learn From BuildDirect.com Technologies' P/S?
Despite BuildDirect.com Technologies' share price climbing recently, its P/S still lags most other companies. Typically, we'd caution against reading too much into price-to-sales ratios when settling on investment decisions, though it can reveal plenty about what other market participants think about the company.
As we suspected, our examination of BuildDirect.com Technologies revealed its shrinking revenue over the medium-term is contributing to its low P/S, given the industry is set to grow. Right now shareholders are accepting the low P/S as they concede future revenue probably won't provide any pleasant surprises either. If recent medium-term revenue trends continue, it's hard to see the share price moving strongly in either direction in the near future under these circumstances.
It's always necessary to consider the ever-present spectre of investment risk. We've identified 2 warning signs with BuildDirect.com Technologies (at least 1 which doesn't sit too well with us), and understanding them should be part of your investment process.
If these risks are making you reconsider your opinion on BuildDirect.com Technologies, explore our interactive list of high quality stocks to get an idea of what else is out there.
Valuation is complex, but we're here to simplify it.
Discover if BuildDirect.com Technologies might be undervalued or overvalued with our detailed analysis, featuring fair value estimates, potential risks, dividends, insider trades, and its financial condition.
Access Free AnalysisHave feedback on this article? Concerned about the content? Get in touch with us directly. Alternatively, email editorial-team (at) simplywallst.com.
This article by Simply Wall St is general in nature. We provide commentary based on historical data and analyst forecasts only using an unbiased methodology and our articles are not intended to be financial advice. It does not constitute a recommendation to buy or sell any stock, and does not take account of your objectives, or your financial situation. We aim to bring you long-term focused analysis driven by fundamental data. Note that our analysis may not factor in the latest price-sensitive company announcements or qualitative material. Simply Wall St has no position in any stocks mentioned.
MI

The Foxhole
A landmark settlement is meant to punish Meta (META). If the 1998 tobacco deal is any guide, it might protect it.
169
ZO
zoe_vi5fn
Any moat with an opt-out clause for your competitors is just a fence around your own garden.
CO
connor_iwn1g
Worth looking at what previous legal action actually did to Meta rather than reaching for tobacco. The FTC's record five billion dollar privacy fine in 2019 was met with the stock rising, because it came in below fears and removed an open question. GDPR was designed to constrain large platforms and increased their share of the European ad market, because compliance cost fell hardest on small intermediaries. The FTC's antitrust case, the one that could genuinely have broken the company up, was decided in Meta's favour last November. The only thing that ever meaningfully hurt the business was Apple changing a tracking default, and Meta out-spent that too, while the ad-tech firms that could not afford to rebuild disappeared. The pattern is not that Meta survives regulation. It is that regulation keeps costing its smaller competitors more.
 Andrew Legget
Market Insights
Great earnings season, but are the earnings real?

At first glance, this was the strongest earnings season in years. But when you look at where the growth actually came from, the story splits into two very different pictures.
10
About TSXV:BILD
BuildDirect.com Technologies
Operates an online e-commerce platform for wood, vinyl, laminate, and other flooring products in the United States and Canada.
Adequate balance sheet with minimal risk.
Similar Companies
Market Insights


Advertisement
Weekly Picks
LO


Lou_Basenese on Oncolytics Biotech ·
The Team Behind a $2 Billion Johnson & Johnson (JNJ) Deal Just Took Over This $105 Million Cancer Biotech
Fair Value:US$3.575.5% undervalued
31 followersusers have followed this narrative
0 commentsusers have commented on this narrative
7 likesusers have liked this narrative
TR


tripledub on Meta Platforms ·
The $135 Billion Bet That Should Make Every Shareholder Nervous
Fair Value:US$5861.4% undervalued
62 followersusers have followed this narrative
3 commentsusers have commented on this narrative
34 likesusers have liked this narrative
TA


Talos on Voyager Technologies ·
The "Landlord of Orbit" – A Deep Value Play Ahead of the Starlab Era
Fair Value:US$385.291.1% undervalued
65 followersusers have followed this narrative
0 commentsusers have commented on this narrative
6 likesusers have liked this narrative
IV

Ivoed on Uber Technologies ·
Uber’s Valuation Depends On Who Captures The Economics Of Driverless Rides
Fair Value:US$11632.1% undervalued
13 followersusers have followed this narrative
0 commentsusers have commented on this narrative
3 likesusers have liked this narrative
Recently Updated Narratives
RO


Robbo on Unilever ·
Unilever (LSE:ULVR), changes in the wind.
Fair Value:UK£42.2813.0% overvalued
1 followerusers have followed this narrative
0 commentsusers have commented on this narrative
0 likesusers have liked this narrative
TR

tripledub on Dusk Group ·
Buying a Dollar for Fifty Cents: The Case for Dusk Group
Fair Value:AU$0.790.6% undervalued
24 followersusers have followed this narrative
3 commentsusers have commented on this narrative
0 likesusers have liked this narrative
TR

tripledub on Taiwan Semiconductor Manufacturing ·
The Most Wonderful Monopoly in the Most Dangerous Neighbourhood on Earth
Fair Value:US$378.2910.4% overvalued
84 followersusers have followed this narrative
1 commentusers have commented on this narrative
0 likesusers have liked this narrative
Popular Narratives
OS


oscargarcia on NVIDIA ·
The company that went from selling GPUs to gamers to becoming the AI arms dealer of the 21st century.
Fair Value:US$28022.3% undervalued
363 followersusers have followed this narrative
9 commentsusers have commented on this narrative
16 likesusers have liked this narrative
CU

CubanEros on Microsoft ·
A wonderful business at reasonable price.
Fair Value:US$419.9122.3% overvalued
212 followersusers have followed this narrative
0 commentsusers have commented on this narrative
9 likesusers have liked this narrative
JO


John_Eric on MercadoLibre ·
MercadoLibre and the Spreadsheet Trick That Decides Everything
Fair Value:US$7.31k73.1% undervalued
125 followersusers have followed this narrative
3 commentsusers have commented on this narrative
17 likesusers have liked this narrative


