
Advertisement
- Canada
- /
- Real Estate
- /
- TSX:AIF
Recent 5.7% pullback isn't enough to hurt long-term Altus Group (TSE:AIF) shareholders, they're still up 24% over 5 years
Altus Group Limited (TSE:AIF) shareholders might be concerned after seeing the share price drop 12% in the last quarter. But at least the stock is up over the last five years. In that time, it is up 17%, which isn't bad, but is below the market return of 104%.
In light of the stock dropping 5.7% in the past week, we want to investigate the longer term story, and see if fundamentals have been the driver of the company's positive five-year return.
There is no denying that markets are sometimes efficient, but prices do not always reflect underlying business performance. One way to examine how market sentiment has changed over time is to look at the interaction between a company's share price and its earnings per share (EPS).
We know that Altus Group has been profitable in the past. However, it made a loss in the last twelve months, suggesting profit may be an unreliable metric at this stage. So we might find other metrics can better explain the share price movements.
The modest 1.2% dividend yield is unlikely to be propping up the share price. On the other hand, Altus Group's revenue is growing nicely, at a compound rate of 4.9% over the last five years. In that case, the company may be sacrificing current earnings per share to drive growth.
You can see below how earnings and revenue have changed over time (discover the exact values by clicking on the image).
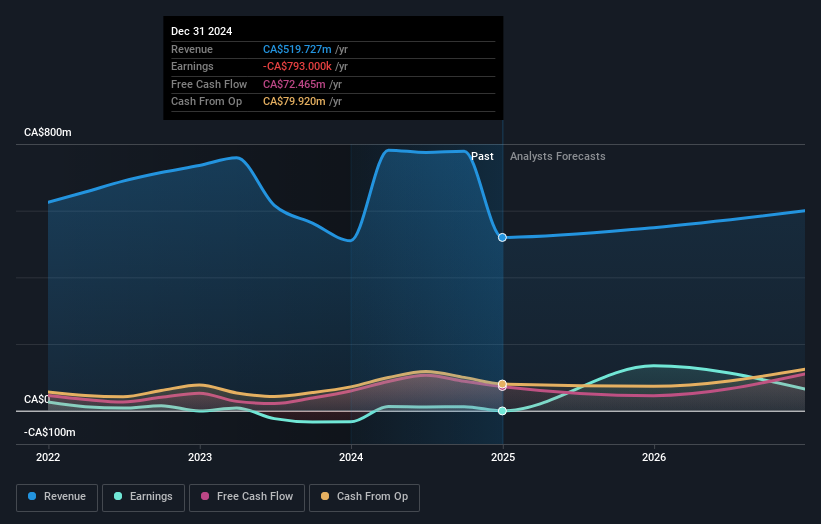
It's probably worth noting we've seen significant insider buying in the last quarter, which we consider a positive. On the other hand, we think the revenue and earnings trends are much more meaningful measures of the business. You can see what analysts are predicting for Altus Group in this interactive graph of future profit estimates .
What About Dividends?
When looking at investment returns, it is important to consider the difference between total shareholder return (TSR) and share price return. The TSR is a return calculation that accounts for the value of cash dividends (assuming that any dividend received was reinvested) and the calculated value of any discounted capital raisings and spin-offs. Arguably, the TSR gives a more comprehensive picture of the return generated by a stock. As it happens, Altus Group's TSR for the last 5 years was 24%, which exceeds the share price return mentioned earlier. This is largely a result of its dividend payments!
A Different Perspective
Altus Group shareholders are down 3.9% for the year (even including dividends), but the market itself is up 12%. Even the share prices of good stocks drop sometimes, but we want to see improvements in the fundamental metrics of a business, before getting too interested. On the bright side, long term shareholders have made money, with a gain of 4% per year over half a decade. It could be that the recent sell-off is an opportunity, so it may be worth checking the fundamental data for signs of a long term growth trend. Investors who like to make money usually check up on insider purchases, such as the price paid, and total amount bought. You can find out about the insider purchases of Altus Group by clicking this link.
If you like to buy stocks alongside management, then you might just love this free list of companies. (Hint: most of them are flying under the radar).
Please note, the market returns quoted in this article reflect the market weighted average returns of stocks that currently trade on Canadian exchanges.
New: Manage All Your Stock Portfolios in One Place
We've created the ultimate portfolio companion for stock investors, and it's free.
• Connect an unlimited number of Portfolios and see your total in one currency
• Be alerted to new Warning Signs or Risks via email or mobile
• Track the Fair Value of your stocks
Have feedback on this article? Concerned about the content? Get in touch with us directly. Alternatively, email editorial-team (at) simplywallst.com.
This article by Simply Wall St is general in nature. We provide commentary based on historical data and analyst forecasts only using an unbiased methodology and our articles are not intended to be financial advice. It does not constitute a recommendation to buy or sell any stock, and does not take account of your objectives, or your financial situation. We aim to bring you long-term focused analysis driven by fundamental data. Note that our analysis may not factor in the latest price-sensitive company announcements or qualitative material. Simply Wall St has no position in any stocks mentioned.
About TSX:AIF
Altus Group
Provides asset and funds intelligence solutions for commercial real estate (CRE) in Canada, the United States, the United Kingdom, France, Europe, the Middle East, Africa, Australia, and the Asia Pacific.
Flawless balance sheet unattractive dividend payer.
Similar Companies
Market Insights

Advertisement
Community Narratives
MicroVision will explode future revenue by 380.37% with a vision towards success
Fair Value US$60.00|98.4% undervalued
TH
Community Contributor
The Indispensable Artery for a New North American Economy
Fair Value CA$132.87|1.3% undervalued
TI
Community Contributor