
Advertisement
Simply Better Brands Corp. (CVE:SBBC) Soars 26% But It's A Story Of Risk Vs Reward
Despite an already strong run, Simply Better Brands Corp. (CVE:SBBC) shares have been powering on, with a gain of 26% in the last thirty days. The annual gain comes to 138% following the latest surge, making investors sit up and take notice.
Although its price has surged higher, it's still not a stretch to say that Simply Better Brands' price-to-sales (or "P/S") ratio of 0.7x right now seems quite "middle-of-the-road" compared to the Pharmaceuticals industry in Canada, where the median P/S ratio is around 1.2x. However, investors might be overlooking a clear opportunity or potential setback if there is no rational basis for the P/S.
See our latest analysis for Simply Better Brands
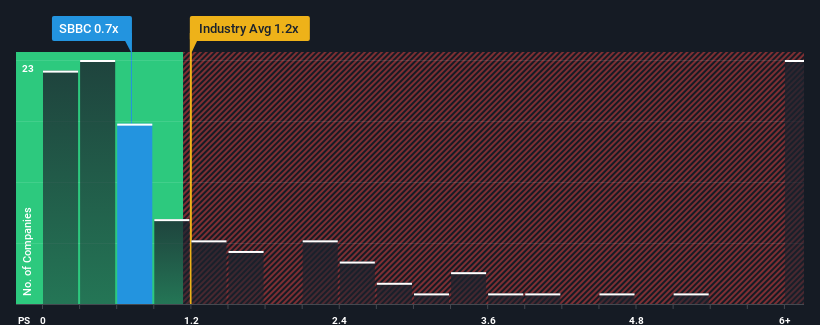
What Does Simply Better Brands' Recent Performance Look Like?
Simply Better Brands has been doing a good job lately as it's been growing revenue at a solid pace. One possibility is that the P/S is moderate because investors think this respectable revenue growth might not be enough to outperform the broader industry in the near future. Those who are bullish on Simply Better Brands will be hoping that this isn't the case, so that they can pick up the stock at a lower valuation.
Want the full picture on earnings, revenue and cash flow for the company? Then our free report on Simply Better Brands will help you shine a light on its historical performance.How Is Simply Better Brands' Revenue Growth Trending?
In order to justify its P/S ratio, Simply Better Brands would need to produce growth that's similar to the industry.
Taking a look back first, we see that the company grew revenue by an impressive 26% last year. Spectacularly, three year revenue growth has ballooned by several orders of magnitude, thanks in part to the last 12 months of revenue growth. Therefore, it's fair to say the revenue growth recently has been superb for the company.
When compared to the industry's one-year growth forecast of 6.5%, the most recent medium-term revenue trajectory is noticeably more alluring
In light of this, it's curious that Simply Better Brands' P/S sits in line with the majority of other companies. It may be that most investors are not convinced the company can maintain its recent growth rates.
The Final Word
Simply Better Brands' stock has a lot of momentum behind it lately, which has brought its P/S level with the rest of the industry. While the price-to-sales ratio shouldn't be the defining factor in whether you buy a stock or not, it's quite a capable barometer of revenue expectations.
We didn't quite envision Simply Better Brands' P/S sitting in line with the wider industry, considering the revenue growth over the last three-year is higher than the current industry outlook. When we see strong revenue with faster-than-industry growth, we can only assume potential risks are what might be placing pressure on the P/S ratio. At least the risk of a price drop looks to be subdued if recent medium-term revenue trends continue, but investors seem to think future revenue could see some volatility.
There are also other vital risk factors to consider and we've discovered 4 warning signs for Simply Better Brands (2 are concerning!) that you should be aware of before investing here.
If these risks are making you reconsider your opinion on Simply Better Brands, explore our interactive list of high quality stocks to get an idea of what else is out there.
Valuation is complex, but we're here to simplify it.
Discover if TRUBAR might be undervalued or overvalued with our detailed analysis, featuring fair value estimates, potential risks, dividends, insider trades, and its financial condition.
Access Free AnalysisHave feedback on this article? Concerned about the content? Get in touch with us directly. Alternatively, email editorial-team (at) simplywallst.com.
This article by Simply Wall St is general in nature. We provide commentary based on historical data and analyst forecasts only using an unbiased methodology and our articles are not intended to be financial advice. It does not constitute a recommendation to buy or sell any stock, and does not take account of your objectives, or your financial situation. We aim to bring you long-term focused analysis driven by fundamental data. Note that our analysis may not factor in the latest price-sensitive company announcements or qualitative material. Simply Wall St has no position in any stocks mentioned.
Have feedback on this article? Concerned about the content? Get in touch with us directly. Alternatively, email editorial-team@simplywallst.com
About TSXV:TRBR
TRUBAR
Operates as a consumer products company with diversified assets in the plant-based and wellness consumer product categories in Canada.
Low risk with limited growth.
Similar Companies
Market Insights

Advertisement
Community Narratives
Finding The True Value Of A Logistics Powerhouse
Fair Value US$95.21|8.4% undervalued
NV
Community Contributor
Paradigm Biopharmaceuticals Will Lead Osteoarthritis Treatment with Zilosul's FDA Success
Fair Value AU$5.50|92.1% undervalued
AM
Community Contributor
Barrick Mining (ABX:CA): A Gold Hedge against a U.S. Shutdown
Fair Value CA$60.00|24.2% undervalued
GM
Community Contributor