
Advertisement
A Look At The Intrinsic Value Of C21 Investments Inc. (CSE:CXXI)
Key Insights
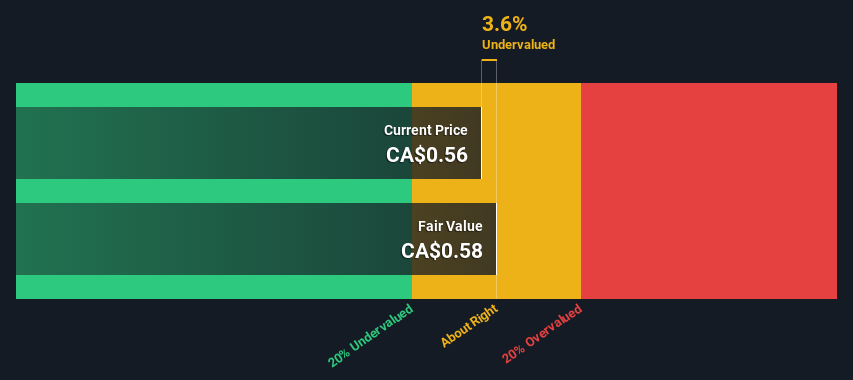
- C21 Investments' estimated fair value is CA$0.58 based on 2 Stage Free Cash Flow to Equity
- Current share price of CA$0.56 suggests C21 Investments is potentially trading close to its fair value
- The average premium for C21 Investments' competitorsis currently 12%
Today we will run through one way of estimating the intrinsic value of C21 Investments Inc. (CSE:CXXI) by taking the expected future cash flows and discounting them to today's value. This will be done using the Discounted Cash Flow (DCF) model. Believe it or not, it's not too difficult to follow, as you'll see from our example!
We generally believe that a company's value is the present value of all of the cash it will generate in the future. However, a DCF is just one valuation metric among many, and it is not without flaws. If you still have some burning questions about this type of valuation, take a look at the Simply Wall St analysis model.
See our latest analysis for C21 Investments
Step By Step Through The Calculation
We use what is known as a 2-stage model, which simply means we have two different periods of growth rates for the company's cash flows. Generally the first stage is higher growth, and the second stage is a lower growth phase. To start off with, we need to estimate the next ten years of cash flows. Seeing as no analyst estimates of free cash flow are available to us, we have extrapolate the previous free cash flow (FCF) from the company's last reported value. We assume companies with shrinking free cash flow will slow their rate of shrinkage, and that companies with growing free cash flow will see their growth rate slow, over this period. We do this to reflect that growth tends to slow more in the early years than it does in later years.
A DCF is all about the idea that a dollar in the future is less valuable than a dollar today, so we need to discount the sum of these future cash flows to arrive at a present value estimate:
10-year free cash flow (FCF) estimate
| 2024 | 2025 | 2026 | 2027 | 2028 | 2029 | 2030 | 2031 | 2032 | 2033 | |
| Levered FCF ($, Millions) | US$2.49m | US$2.29m | US$2.17m | US$2.11m | US$2.08m | US$2.07m | US$2.08m | US$2.10m | US$2.12m | US$2.15m |
| Growth Rate Estimate Source | Est @ -12.23% | Est @ -7.96% | Est @ -4.98% | Est @ -2.89% | Est @ -1.42% | Est @ -0.40% | Est @ 0.32% | Est @ 0.82% | Est @ 1.17% | Est @ 1.42% |
| Present Value ($, Millions) Discounted @ 5.7% | US$2.4 | US$2.0 | US$1.8 | US$1.7 | US$1.6 | US$1.5 | US$1.4 | US$1.3 | US$1.3 | US$1.2 |
("Est" = FCF growth rate estimated by Simply Wall St)
Present Value of 10-year Cash Flow (PVCF) = US$16m
The second stage is also known as Terminal Value, this is the business's cash flow after the first stage. The Gordon Growth formula is used to calculate Terminal Value at a future annual growth rate equal to the 5-year average of the 10-year government bond yield of 2.0%. We discount the terminal cash flows to today's value at a cost of equity of 5.7%.
Terminal Value (TV)= FCF2033 × (1 + g) ÷ (r – g) = US$2.2m× (1 + 2.0%) ÷ (5.7%– 2.0%) = US$60m
Present Value of Terminal Value (PVTV)= TV / (1 + r)10= US$60m÷ ( 1 + 5.7%)10= US$34m
The total value, or equity value, is then the sum of the present value of the future cash flows, which in this case is US$51m. In the final step we divide the equity value by the number of shares outstanding. Relative to the current share price of CA$0.6, the company appears about fair value at a 3.6% discount to where the stock price trades currently. Remember though, that this is just an approximate valuation, and like any complex formula - garbage in, garbage out.
The Assumptions
Now the most important inputs to a discounted cash flow are the discount rate, and of course, the actual cash flows. You don't have to agree with these inputs, I recommend redoing the calculations yourself and playing with them. The DCF also does not consider the possible cyclicality of an industry, or a company's future capital requirements, so it does not give a full picture of a company's potential performance. Given that we are looking at C21 Investments as potential shareholders, the cost of equity is used as the discount rate, rather than the cost of capital (or weighted average cost of capital, WACC) which accounts for debt. In this calculation we've used 5.7%, which is based on a levered beta of 0.800. Beta is a measure of a stock's volatility, compared to the market as a whole. We get our beta from the industry average beta of globally comparable companies, with an imposed limit between 0.8 and 2.0, which is a reasonable range for a stable business.
Looking Ahead:
Whilst important, the DCF calculation is only one of many factors that you need to assess for a company. DCF models are not the be-all and end-all of investment valuation. Rather it should be seen as a guide to "what assumptions need to be true for this stock to be under/overvalued?" For instance, if the terminal value growth rate is adjusted slightly, it can dramatically alter the overall result. For C21 Investments, there are three further elements you should explore:
- Risks: Consider for instance, the ever-present spectre of investment risk. We've identified 2 warning signs with C21 Investments (at least 1 which shouldn't be ignored) , and understanding these should be part of your investment process.
- Other High Quality Alternatives: Do you like a good all-rounder? Explore our interactive list of high quality stocks to get an idea of what else is out there you may be missing!
- Other Top Analyst Picks: Interested to see what the analysts are thinking? Take a look at our interactive list of analysts' top stock picks to find out what they feel might have an attractive future outlook!
PS. Simply Wall St updates its DCF calculation for every Canadian stock every day, so if you want to find the intrinsic value of any other stock just search here.
New: AI Stock Screener & Alerts
Our new AI Stock Screener scans the market every day to uncover opportunities.
• Dividend Powerhouses (3%+ Yield)
• Undervalued Small Caps with Insider Buying
• High growth Tech and AI Companies
Or build your own from over 50 metrics.
Have feedback on this article? Concerned about the content? Get in touch with us directly. Alternatively, email editorial-team (at) simplywallst.com.
This article by Simply Wall St is general in nature. We provide commentary based on historical data and analyst forecasts only using an unbiased methodology and our articles are not intended to be financial advice. It does not constitute a recommendation to buy or sell any stock, and does not take account of your objectives, or your financial situation. We aim to bring you long-term focused analysis driven by fundamental data. Note that our analysis may not factor in the latest price-sensitive company announcements or qualitative material. Simply Wall St has no position in any stocks mentioned.
About CNSX:CXXI
C21 Investments
An integrated cannabis company, cultivates, processes, distributes, and sells cannabis and hemp-derived consumer products in the United States.
Excellent balance sheet with low risk.
Market Insights

Advertisement
Community Narratives
MicroVision will explode future revenue by 380.37% with a vision towards success
Fair Value US$60.00|98.4% undervalued
TH
Community Contributor
The Indispensable Artery for a New North American Economy
Fair Value CA$132.87|1.3% undervalued
TI
Community Contributor