
Advertisement
- Canada
- /
- Entertainment
- /
- TSXV:ESE
It's Down 30% But ESE Entertainment Inc. (CVE:ESE) Could Be Riskier Than It Looks
ESE Entertainment Inc. (CVE:ESE) shares have had a horrible month, losing 30% after a relatively good period beforehand. The recent drop completes a disastrous twelve months for shareholders, who are sitting on a 78% loss during that time.
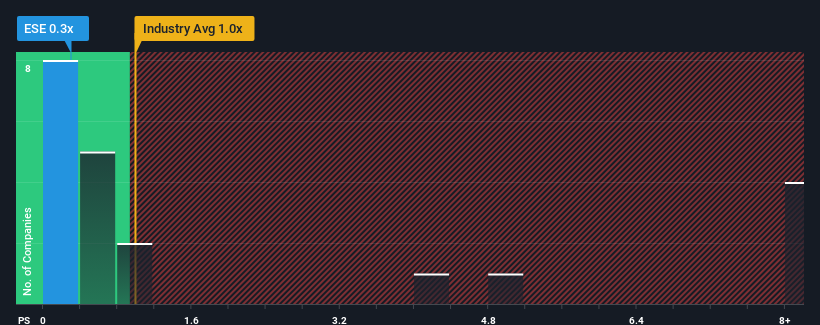
Although its price has dipped substantially, it's still not a stretch to say that ESE Entertainment's price-to-sales (or "P/S") ratio of 0.3x right now seems quite "middle-of-the-road" compared to the Entertainment industry in Canada, where the median P/S ratio is around 0.6x. While this might not raise any eyebrows, if the P/S ratio is not justified investors could be missing out on a potential opportunity or ignoring looming disappointment.
View our latest analysis for ESE Entertainment
How Has ESE Entertainment Performed Recently?
For example, consider that ESE Entertainment's financial performance has been poor lately as its revenue has been in decline. Perhaps investors believe the recent revenue performance is enough to keep in line with the industry, which is keeping the P/S from dropping off. If you like the company, you'd at least be hoping this is the case so that you could potentially pick up some stock while it's not quite in favour.
Although there are no analyst estimates available for ESE Entertainment, take a look at this free data-rich visualisation to see how the company stacks up on earnings, revenue and cash flow.Is There Some Revenue Growth Forecasted For ESE Entertainment?
In order to justify its P/S ratio, ESE Entertainment would need to produce growth that's similar to the industry.
In reviewing the last year of financials, we were disheartened to see the company's revenues fell to the tune of 16%. In spite of this, the company still managed to deliver immense revenue growth over the last three years. Therefore, it's fair to say the revenue growth recently has been superb for the company, but investors will want to ask why it is now in decline.
Comparing that recent medium-term revenue trajectory with the industry's one-year growth forecast of 25% shows it's noticeably more attractive.
With this information, we find it interesting that ESE Entertainment is trading at a fairly similar P/S compared to the industry. It may be that most investors are not convinced the company can maintain its recent growth rates.
What We Can Learn From ESE Entertainment's P/S?
With its share price dropping off a cliff, the P/S for ESE Entertainment looks to be in line with the rest of the Entertainment industry. Using the price-to-sales ratio alone to determine if you should sell your stock isn't sensible, however it can be a practical guide to the company's future prospects.
We've established that ESE Entertainment currently trades on a lower than expected P/S since its recent three-year growth is higher than the wider industry forecast. It'd be fair to assume that potential risks the company faces could be the contributing factor to the lower than expected P/S. At least the risk of a price drop looks to be subdued if recent medium-term revenue trends continue, but investors seem to think future revenue could see some volatility.
You should always think about risks. Case in point, we've spotted 5 warning signs for ESE Entertainment you should be aware of, and 3 of them can't be ignored.
If companies with solid past earnings growth is up your alley, you may wish to see this free collection of other companies with strong earnings growth and low P/E ratios.
Valuation is complex, but we're here to simplify it.
Discover if ESE Entertainment might be undervalued or overvalued with our detailed analysis, featuring fair value estimates, potential risks, dividends, insider trades, and its financial condition.
Access Free AnalysisHave feedback on this article? Concerned about the content? Get in touch with us directly. Alternatively, email editorial-team (at) simplywallst.com.
This article by Simply Wall St is general in nature. We provide commentary based on historical data and analyst forecasts only using an unbiased methodology and our articles are not intended to be financial advice. It does not constitute a recommendation to buy or sell any stock, and does not take account of your objectives, or your financial situation. We aim to bring you long-term focused analysis driven by fundamental data. Note that our analysis may not factor in the latest price-sensitive company announcements or qualitative material. Simply Wall St has no position in any stocks mentioned.
About TSXV:ESE
ESE Entertainment
An entertainment company, focuses on gaming and esports in Canada and internationally.
Moderate risk with imperfect balance sheet.
Market Insights

Advertisement
Weekly Picks
FA

FAI on Arabian Internet and Communication Services ·
Solutions by stc: 34% Upside in Saudi's Digital Transformation Leader
Fair Value:ر.س342.2335.5% undervalued
10 followersusers have followed this narrative
1 commentusers have commented on this narrative
4 likesusers have liked this narrative
RO


RobertoAllende on NVIDIA ·
The AI Infrastructure Giant Grows Into Its Valuation
Fair Value:US$345.0747.9% undervalued
28 followersusers have followed this narrative
28 commentsusers have commented on this narrative
21 likesusers have liked this narrative
Recently Updated Narratives
TA

Talos on NVIDIA ·
Not a Bubble, But the "Industrial Revolution 4.0" Engine
Fair Value:US$294.9239.0% undervalued
1 followerusers have followed this narrative
0 commentsusers have commented on this narrative
0 likesusers have liked this narrative
TA

Talos on Advanced Micro Devices ·
The "David vs. Goliath" AI Trade – Why Second Place is Worth Billions
Fair Value:US$416.4647.2% undervalued
2 followersusers have followed this narrative
0 commentsusers have commented on this narrative
0 likesusers have liked this narrative
TA

Talos on PayPal Holdings ·
The "Sleeping Giant" Wakes Up – Efficiency & Monetization
Fair Value:US$174.9264.2% undervalued
5 followersusers have followed this narrative
0 commentsusers have commented on this narrative
0 likesusers have liked this narrative
Popular Narratives
TH


TheWallstreetKing on MicroVision ·
MicroVision will explode future revenue by 380.37% with a vision towards success
Fair Value:US$6098.6% undervalued
111 followersusers have followed this narrative
11 commentsusers have commented on this narrative
22 likesusers have liked this narrative
AN

AnalystConsensusTarget on NVIDIA ·
NVDA: Expanding AI Demand Will Drive Major Data Center Investments Through 2026
Fair Value:US$250.3928.1% undervalued
945 followersusers have followed this narrative
6 commentsusers have commented on this narrative
24 likesusers have liked this narrative
OS


oscargarcia on Alphabet ·
The company that turned a verb into a global necessity and basically runs the modern internet, digital ads, smartphones, maps, and AI.
Fair Value:US$3407.4% undervalued
147 followersusers have followed this narrative
6 commentsusers have commented on this narrative
18 likesusers have liked this narrative