Stock Analysis
- Canada
- /
- Interactive Media and Services
- /
- TSXV:EQ
EQ Full Year 2023 Earnings: CA$0.085 loss per share (vs CA$0.093 loss in FY 2022)


EQ (CVE:EQ) Full Year 2023 Results
Key Financial Results
- Revenue: CA$9.96m (down 9.2% from FY 2022).
- Net loss: CA$5.90m (loss narrowed by 8.3% from FY 2022).
- CA$0.085 loss per share (improved from CA$0.093 loss in FY 2022).
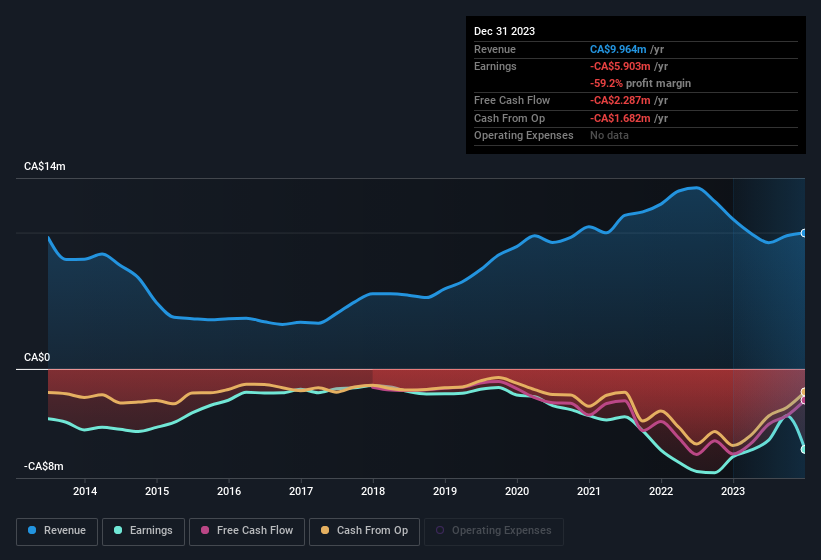
All figures shown in the chart above are for the trailing 12 month (TTM) period
EQ's share price is broadly unchanged from a week ago.
Risk Analysis
Don't forget that there may still be risks. For instance, we've identified 4 warning signs for EQ (3 can't be ignored) you should be aware of.
Valuation is complex, but we're helping make it simple.
Find out whether EQ is potentially over or undervalued by checking out our comprehensive analysis, which includes fair value estimates, risks and warnings, dividends, insider transactions and financial health.
View the Free AnalysisHave feedback on this article? Concerned about the content? Get in touch with us directly. Alternatively, email editorial-team (at) simplywallst.com.
This article by Simply Wall St is general in nature. We provide commentary based on historical data and analyst forecasts only using an unbiased methodology and our articles are not intended to be financial advice. It does not constitute a recommendation to buy or sell any stock, and does not take account of your objectives, or your financial situation. We aim to bring you long-term focused analysis driven by fundamental data. Note that our analysis may not factor in the latest price-sensitive company announcements or qualitative material. Simply Wall St has no position in any stocks mentioned.
About TSXV:EQ
EQ
EQ Inc. provides real-time technology and advance analytics in Canada and the United States.
Weak fundamentals or lack of information.
