
Advertisement
Howard Marks put it nicely when he said that, rather than worrying about share price volatility, 'The possibility of permanent loss is the risk I worry about... and every practical investor I know worries about.' It's only natural to consider a company's balance sheet when you examine how risky it is, since debt is often involved when a business collapses. We note that Angkor Resources Corp. (CVE:ANK) does have debt on its balance sheet. But is this debt a concern to shareholders?
Why Does Debt Bring Risk?
Debt and other liabilities become risky for a business when it cannot easily fulfill those obligations, either with free cash flow or by raising capital at an attractive price. Part and parcel of capitalism is the process of 'creative destruction' where failed businesses are mercilessly liquidated by their bankers. However, a more frequent (but still costly) occurrence is where a company must issue shares at bargain-basement prices, permanently diluting shareholders, just to shore up its balance sheet. Of course, the upside of debt is that it often represents cheap capital, especially when it replaces dilution in a company with the ability to reinvest at high rates of return. The first step when considering a company's debt levels is to consider its cash and debt together.
See our latest analysis for Angkor Resources
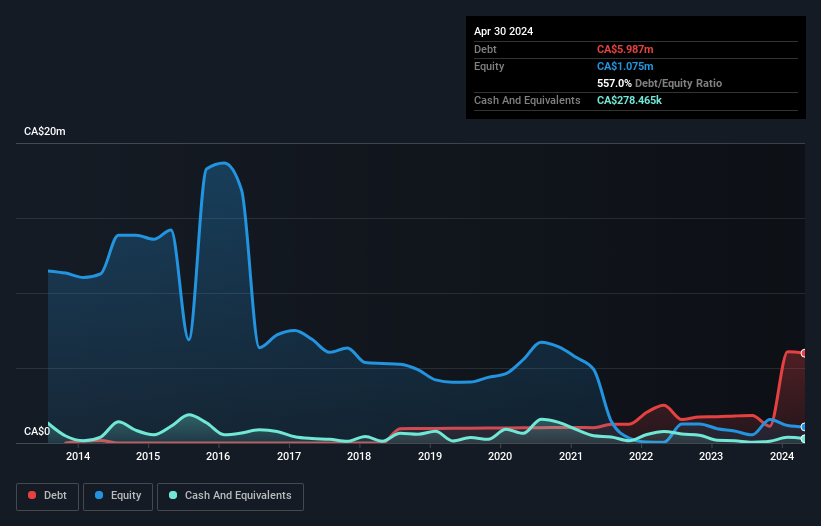
What Is Angkor Resources's Debt?
You can click the graphic below for the historical numbers, but it shows that as of April 2024 Angkor Resources had CA$5.99m of debt, an increase on CA$1.80m, over one year. However, because it has a cash reserve of CA$278.5k, its net debt is less, at about CA$5.71m.
A Look At Angkor Resources' Liabilities
The latest balance sheet data shows that Angkor Resources had liabilities of CA$2.48m due within a year, and liabilities of CA$4.46m falling due after that. Offsetting these obligations, it had cash of CA$278.5k as well as receivables valued at CA$308.3k due within 12 months. So its liabilities outweigh the sum of its cash and (near-term) receivables by CA$6.36m.
Angkor Resources has a market capitalization of CA$21.2m, so it could very likely raise cash to ameliorate its balance sheet, if the need arose. However, it is still worthwhile taking a close look at its ability to pay off debt. When analysing debt levels, the balance sheet is the obvious place to start. But it is Angkor Resources's earnings that will influence how the balance sheet holds up in the future. So if you're keen to discover more about its earnings, it might be worth checking out this graph of its long term earnings trend.
Given its lack of meaningful operating revenue, investors are probably hoping that Angkor Resources finds some valuable resources, before it runs out of money.
Caveat Emptor
Over the last twelve months Angkor Resources produced an earnings before interest and tax (EBIT) loss. Indeed, it lost CA$1.1m at the EBIT level. When we look at that and recall the liabilities on its balance sheet, relative to cash, it seems unwise to us for the company to have any debt. So we think its balance sheet is a little strained, though not beyond repair. However, it doesn't help that it burned through CA$873k of cash over the last year. So suffice it to say we do consider the stock to be risky. There's no doubt that we learn most about debt from the balance sheet. But ultimately, every company can contain risks that exist outside of the balance sheet. Be aware that Angkor Resources is showing 5 warning signs in our investment analysis , and 3 of those shouldn't be ignored...
If, after all that, you're more interested in a fast growing company with a rock-solid balance sheet, then check out our list of net cash growth stocks without delay.
New: Manage All Your Stock Portfolios in One Place
We've created the ultimate portfolio companion for stock investors, and it's free.
• Connect an unlimited number of Portfolios and see your total in one currency
• Be alerted to new Warning Signs or Risks via email or mobile
• Track the Fair Value of your stocks
Have feedback on this article? Concerned about the content? Get in touch with us directly. Alternatively, email editorial-team (at) simplywallst.com.
This article by Simply Wall St is general in nature. We provide commentary based on historical data and analyst forecasts only using an unbiased methodology and our articles are not intended to be financial advice. It does not constitute a recommendation to buy or sell any stock, and does not take account of your objectives, or your financial situation. We aim to bring you long-term focused analysis driven by fundamental data. Note that our analysis may not factor in the latest price-sensitive company announcements or qualitative material. Simply Wall St has no position in any stocks mentioned.
Have feedback on this article? Concerned about the content? Get in touch with us directly. Alternatively, email editorial-team@simplywallst.com
About TSXV:ANK
Angkor Resources
Engages in the acquisition, exploration, and development of mineral, and oil and gas properties in Canada, Cambodia, and Singapore.
Low risk with imperfect balance sheet.
Market Insights

Advertisement
Community Narratives
MINISO's fair value is projected at 26.69 with an anticipated PE ratio shift of 20x
Fair Value US$24.03|11.0% undervalued
BE
Community Contributor
Procter & Gamble: A Dividend Giant Facing Slowing Growth
Fair Value US$119.81|23.3% overvalued
AN
Community Contributor
Eli Lilly's Future Growth Driven by Tirzepatide and Favorable Market Conditions
Fair Value US$1.19k|13.8% undervalued
EA
Community Contributor