
Advertisement
There's no doubt that money can be made by owning shares of unprofitable businesses. For example, although Amazon.com made losses for many years after listing, if you had bought and held the shares since 1999, you would have made a fortune. But the harsh reality is that very many loss making companies burn through all their cash and go bankrupt.
Given this risk, we thought we'd take a look at whether TRX Gold (TSE:TNX) shareholders should be worried about its cash burn. In this article, we define cash burn as its annual (negative) free cash flow, which is the amount of money a company spends each year to fund its growth. The first step is to compare its cash burn with its cash reserves, to give us its 'cash runway'.
Check out our latest analysis for TRX Gold
How Long Is TRX Gold's Cash Runway?
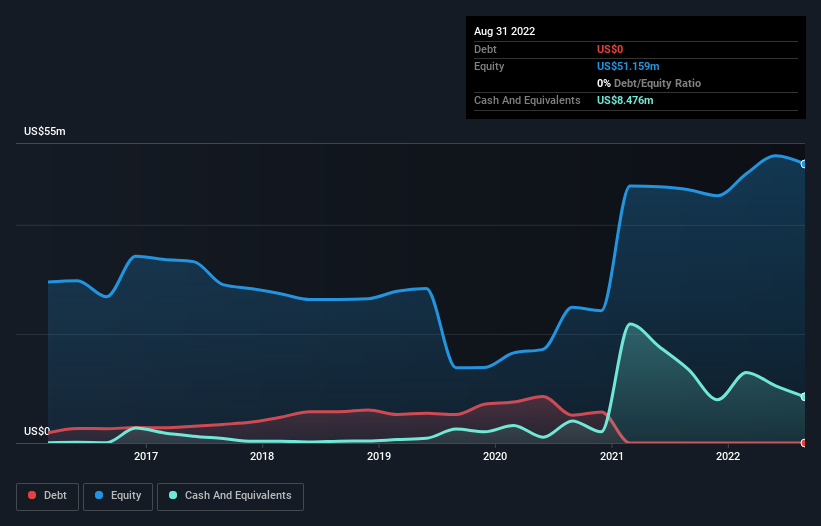
A cash runway is defined as the length of time it would take a company to run out of money if it kept spending at its current rate of cash burn. When TRX Gold last reported its balance sheet in August 2022, it had zero debt and cash worth US$8.5m. In the last year, its cash burn was US$9.7m. Therefore, from August 2022 it had roughly 10 months of cash runway. That's quite a short cash runway, indicating the company must either reduce its annual cash burn or replenish its cash. Depicted below, you can see how its cash holdings have changed over time.
How Is TRX Gold's Cash Burn Changing Over Time?
Whilst it's great to see that TRX Gold has already begun generating revenue from operations, last year it only produced US$15m, so we don't think it is generating significant revenue, at this point. As a result, we think it's a bit early to focus on the revenue growth, so we'll limit ourselves to looking at how the cash burn is changing over time. Given the length of the cash runway, we'd interpret the 42% reduction in cash burn, in twelve months, as prudent if not necessary for capital preservation. While the past is always worth studying, it is the future that matters most of all. So you might want to take a peek at how much the company is expected to grow in the next few years.
Can TRX Gold Raise More Cash Easily?
Even though it has reduced its cash burn recently, shareholders should still consider how easy it would be for TRX Gold to raise more cash in the future. Issuing new shares, or taking on debt, are the most common ways for a listed company to raise more money for its business. Commonly, a business will sell new shares in itself to raise cash and drive growth. By looking at a company's cash burn relative to its market capitalisation, we gain insight on how much shareholders would be diluted if the company needed to raise enough cash to cover another year's cash burn.
TRX Gold has a market capitalisation of US$115m and burnt through US$9.7m last year, which is 8.4% of the company's market value. That's a low proportion, so we figure the company would be able to raise more cash to fund growth, with a little dilution, or even to simply borrow some money.
Is TRX Gold's Cash Burn A Worry?
On this analysis of TRX Gold's cash burn, we think its cash burn relative to its market cap was reassuring, while its cash runway has us a bit worried. Even though we don't think it has a problem with its cash burn, the analysis we've done in this article does suggest that shareholders should give some careful thought to the potential cost of raising more money in the future. Taking a deeper dive, we've spotted 3 warning signs for TRX Gold you should be aware of, and 2 of them make us uncomfortable.
Of course, you might find a fantastic investment by looking elsewhere. So take a peek at this free list of companies insiders are buying, and this list of stocks growth stocks (according to analyst forecasts)
Valuation is complex, but we're here to simplify it.
Discover if TRX Gold might be undervalued or overvalued with our detailed analysis, featuring fair value estimates, potential risks, dividends, insider trades, and its financial condition.
Access Free AnalysisHave feedback on this article? Concerned about the content? Get in touch with us directly. Alternatively, email editorial-team (at) simplywallst.com.
This article by Simply Wall St is general in nature. We provide commentary based on historical data and analyst forecasts only using an unbiased methodology and our articles are not intended to be financial advice. It does not constitute a recommendation to buy or sell any stock, and does not take account of your objectives, or your financial situation. We aim to bring you long-term focused analysis driven by fundamental data. Note that our analysis may not factor in the latest price-sensitive company announcements or qualitative material. Simply Wall St has no position in any stocks mentioned.
About TSX:TRX
TRX Gold
A junior gold mining company, engages in the exploration, development, and production of mineral property in Tanzania.
Undervalued with excellent balance sheet.
Market Insights

Advertisement
Community Narratives
MicroVision will explode future revenue by 380.37% with a vision towards success
Fair Value US$60.00|98.4% undervalued
TH
Community Contributor
The Indispensable Artery for a New North American Economy
Fair Value CA$132.87|1.3% undervalued
TI
Community Contributor