- Canada
- /
- Metals and Mining
- /
- TSX:TFPM
Estimating The Intrinsic Value Of Triple Flag Precious Metals Corp. (TSE:TFPM)


Today we'll do a simple run through of a valuation method used to estimate the attractiveness of Triple Flag Precious Metals Corp. (TSE:TFPM) as an investment opportunity by projecting its future cash flows and then discounting them to today's value. We will take advantage of the Discounted Cash Flow (DCF) model for this purpose. There's really not all that much to it, even though it might appear quite complex.
Remember though, that there are many ways to estimate a company's value, and a DCF is just one method. If you still have some burning questions about this type of valuation, take a look at the Simply Wall St analysis model.
See our latest analysis for Triple Flag Precious Metals
Is Triple Flag Precious Metals fairly valued?
We are going to use a two-stage DCF model, which, as the name states, takes into account two stages of growth. The first stage is generally a higher growth period which levels off heading towards the terminal value, captured in the second 'steady growth' period. To start off with, we need to estimate the next ten years of cash flows. Where possible we use analyst estimates, but when these aren't available we extrapolate the previous free cash flow (FCF) from the last estimate or reported value. We assume companies with shrinking free cash flow will slow their rate of shrinkage, and that companies with growing free cash flow will see their growth rate slow, over this period. We do this to reflect that growth tends to slow more in the early years than it does in later years.
A DCF is all about the idea that a dollar in the future is less valuable than a dollar today, so we discount the value of these future cash flows to their estimated value in today's dollars:
10-year free cash flow (FCF) forecast
| 2023 | 2024 | 2025 | 2026 | 2027 | 2028 | 2029 | 2030 | 2031 | 2032 | |
| Levered FCF ($, Millions) | US$130.3m | US$149.0m | US$122.0m | US$106.9m | US$98.2m | US$93.1m | US$90.1m | US$88.6m | US$87.9m | US$87.9m |
| Growth Rate Estimate Source | Analyst x3 | Analyst x1 | Analyst x1 | Est @ -12.35% | Est @ -8.16% | Est @ -5.22% | Est @ -3.17% | Est @ -1.73% | Est @ -0.72% | Est @ -0.01% |
| Present Value ($, Millions) Discounted @ 6.0% | US$123 | US$133 | US$102 | US$84.7 | US$73.4 | US$65.7 | US$60.0 | US$55.6 | US$52.1 | US$49.2 |
("Est" = FCF growth rate estimated by Simply Wall St)
Present Value of 10-year Cash Flow (PVCF) = US$798m
After calculating the present value of future cash flows in the initial 10-year period, we need to calculate the Terminal Value, which accounts for all future cash flows beyond the first stage. The Gordon Growth formula is used to calculate Terminal Value at a future annual growth rate equal to the 5-year average of the 10-year government bond yield of 1.6%. We discount the terminal cash flows to today's value at a cost of equity of 6.0%.
Terminal Value (TV)= FCF2032 × (1 + g) ÷ (r – g) = US$88m× (1 + 1.6%) ÷ (6.0%– 1.6%) = US$2.1b
Present Value of Terminal Value (PVTV)= TV / (1 + r)10= US$2.1b÷ ( 1 + 6.0%)10= US$1.1b
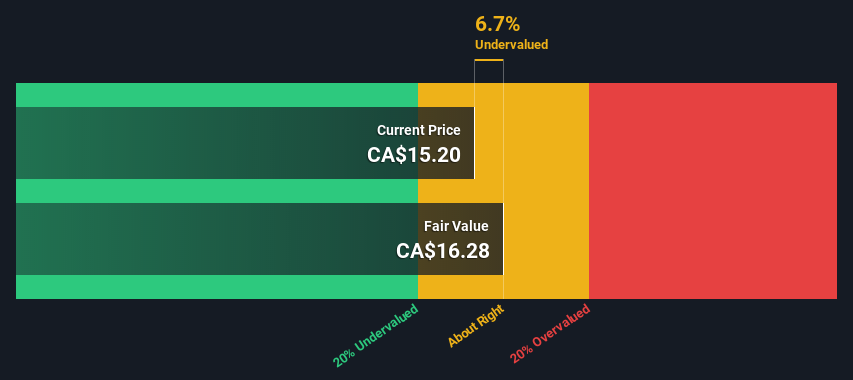
The total value, or equity value, is then the sum of the present value of the future cash flows, which in this case is US$1.9b. To get the intrinsic value per share, we divide this by the total number of shares outstanding. Relative to the current share price of CA$15.2, the company appears about fair value at a 6.7% discount to where the stock price trades currently. Valuations are imprecise instruments though, rather like a telescope - move a few degrees and end up in a different galaxy. Do keep this in mind.
Important assumptions
The calculation above is very dependent on two assumptions. The first is the discount rate and the other is the cash flows. If you don't agree with these result, have a go at the calculation yourself and play with the assumptions. The DCF also does not consider the possible cyclicality of an industry, or a company's future capital requirements, so it does not give a full picture of a company's potential performance. Given that we are looking at Triple Flag Precious Metals as potential shareholders, the cost of equity is used as the discount rate, rather than the cost of capital (or weighted average cost of capital, WACC) which accounts for debt. In this calculation we've used 6.0%, which is based on a levered beta of 1.027. Beta is a measure of a stock's volatility, compared to the market as a whole. We get our beta from the industry average beta of globally comparable companies, with an imposed limit between 0.8 and 2.0, which is a reasonable range for a stable business.
Looking Ahead:
Valuation is only one side of the coin in terms of building your investment thesis, and it is only one of many factors that you need to assess for a company. DCF models are not the be-all and end-all of investment valuation. Rather it should be seen as a guide to "what assumptions need to be true for this stock to be under/overvalued?" If a company grows at a different rate, or if its cost of equity or risk free rate changes sharply, the output can look very different. For Triple Flag Precious Metals, there are three fundamental factors you should assess:
- Risks: Case in point, we've spotted 2 warning signs for Triple Flag Precious Metals you should be aware of.
- Future Earnings: How does TFPM's growth rate compare to its peers and the wider market? Dig deeper into the analyst consensus number for the upcoming years by interacting with our free analyst growth expectation chart.
- Other High Quality Alternatives: Do you like a good all-rounder? Explore our interactive list of high quality stocks to get an idea of what else is out there you may be missing!
PS. Simply Wall St updates its DCF calculation for every Canadian stock every day, so if you want to find the intrinsic value of any other stock just search here.
Valuation is complex, but we're here to simplify it.
Discover if Triple Flag Precious Metals might be undervalued or overvalued with our detailed analysis, featuring fair value estimates, potential risks, dividends, insider trades, and its financial condition.
Access Free AnalysisHave feedback on this article? Concerned about the content? Get in touch with us directly. Alternatively, email editorial-team (at) simplywallst.com.
This article by Simply Wall St is general in nature. We provide commentary based on historical data and analyst forecasts only using an unbiased methodology and our articles are not intended to be financial advice. It does not constitute a recommendation to buy or sell any stock, and does not take account of your objectives, or your financial situation. We aim to bring you long-term focused analysis driven by fundamental data. Note that our analysis may not factor in the latest price-sensitive company announcements or qualitative material. Simply Wall St has no position in any stocks mentioned.
About TSX:TFPM
Triple Flag Precious Metals
A precious-metals-focused streaming and royalty company, engages in acquiring and managing precious metals, streams, royalties and other mineral interests in Australia, Canada, Colombia, Cote d’Ivoire, Honduras, Mexico, Mongolia, Peru, South Africa, the United States, and internationally.
Excellent balance sheet and fair value.

