Advertisement
- Canada
- /
- Metals and Mining
- /
- TSX:OR
OR (TSX:OR) Valuation: How Does the 75x P/E Reflect Future Growth Prospects?

Simply Wall St
Reviewed by Simply Wall St
OR Royalties (TSX:OR) stock has caught the attention of investors recently, drawing interest as market participants assess its current valuation in relation to recent performance. Strong returns over the past year highlight key factors that are driving sentiment.
See our latest analysis for OR Royalties.
OR Royalties has delivered a remarkable run, with the share price up over 64% so far this year and a massive 220% five-year total shareholder return. Short-term volatility continues to shape investor sentiment, but recent fluctuations have not dampened the underlying momentum. This reflects renewed optimism about the company's growth prospects and shifting perceptions of value within the sector.
If you're looking to widen your investing lens, it's a great moment to explore fast growing stocks with high insider ownership.
With such impressive returns and continued growth, investors may wonder whether OR Royalties is undervalued based on its future potential, or if the current price already reflects all of the company’s upside.
Price-to-Earnings of 75x: Is it justified?
OR Royalties currently trades at a price-to-earnings (P/E) ratio of 75x, a premium level that far exceeds both its industry peers and market averages. At a last close price of CA$44.16, the stock appears significantly more expensive than other metals and mining companies.
The price-to-earnings ratio indicates how much investors are willing to pay today for every dollar of earnings the company generates. In the metals and mining sector, this multiple often reflects growth prospects or expectations of future profitability. A high P/E can suggest the market anticipates rapid earnings expansion, but it also raises the bar for the company to deliver on those expectations.
Compared to the Canadian Metals and Mining industry average of 19.8x and a peer group average of 18x, OR Royalties’ P/E of 75x stands out as expensive. Based on regression analysis, the estimated “fair” P/E ratio for the company is 22.8x. This highlights how stretched current valuations are relative to historical sector norms and what the market could potentially revert toward.
Explore the SWS fair ratio for OR Royalties
Result: Price-to-Earnings of 75x (OVERVALUED)
However, ongoing sector volatility and stretched valuations could quickly reverse sentiment if earnings or growth miss expectations.
Find out about the key risks to this OR Royalties narrative.
Another View: What Does the SWS DCF Model Say?
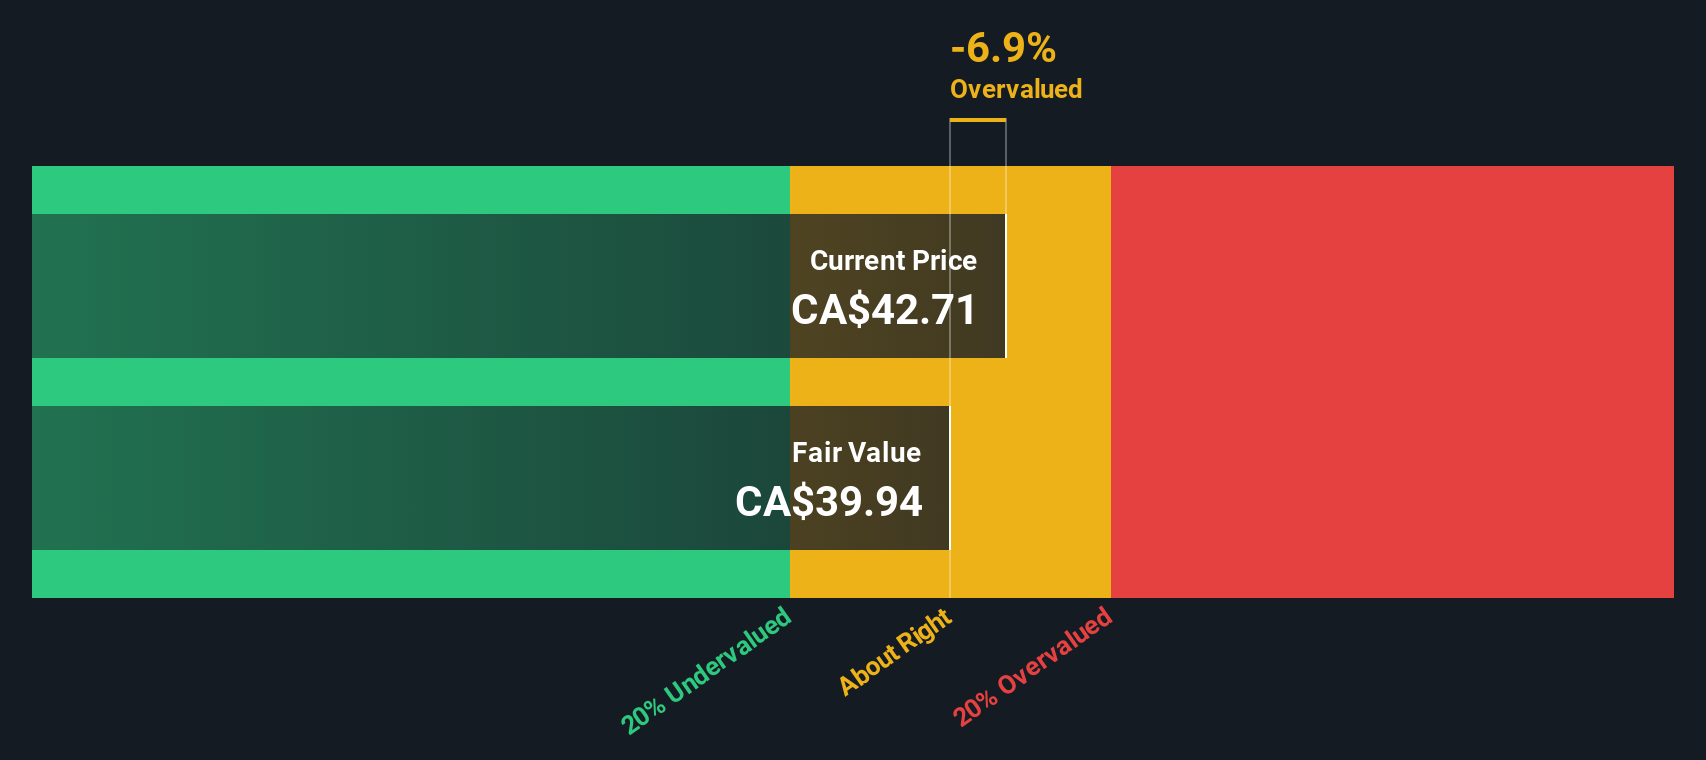
While the market’s focus is on the high earnings multiple, our DCF model tells a different story. According to this method, OR Royalties’ shares are trading about 14% below their fair value estimate. This suggests there could be more potential upside than the current multiples might indicate. Could this gap signal an opportunity or a risk for long-term investors?
Look into how the SWS DCF model arrives at its fair value.
Simply Wall St performs a discounted cash flow (DCF) on every stock in the world every day (check out OR Royalties for example). We show the entire calculation in full. You can track the result in your watchlist or portfolio and be alerted when this changes, or use our stock screener to discover 838 undervalued stocks based on their cash flows. If you save a screener we even alert you when new companies match - so you never miss a potential opportunity.
Build Your Own OR Royalties Narrative
If you think the story could be different or want to dig deeper into the numbers, crafting your own research and perspective is quick and straightforward. Do it your way.
A good starting point is our analysis highlighting 4 key rewards investors are optimistic about regarding OR Royalties.
Looking for More Investment Ideas?
Don’t let powerful opportunities slip through your fingers. Take charge of your portfolio and unlock fresh possibilities today with these hand-picked investment screens from Simply Wall Street:
- Boost your passive income with companies offering attractive yields by checking out these 20 dividend stocks with yields > 3% paying more than 3%.
- Ride the momentum in artificial intelligence and back tomorrow’s winners when you spot these 26 AI penny stocks with cutting-edge tech potential.
- Get ahead of the crowd by targeting value plays and run the numbers on these 838 undervalued stocks based on cash flows based on future cash flows.
This article by Simply Wall St is general in nature. We provide commentary based on historical data and analyst forecasts only using an unbiased methodology and our articles are not intended to be financial advice. It does not constitute a recommendation to buy or sell any stock, and does not take account of your objectives, or your financial situation. We aim to bring you long-term focused analysis driven by fundamental data. Note that our analysis may not factor in the latest price-sensitive company announcements or qualitative material. Simply Wall St has no position in any stocks mentioned.
New: AI Stock Screener & Alerts
Our new AI Stock Screener scans the market every day to uncover opportunities.
• Dividend Powerhouses (3%+ Yield)
• Undervalued Small Caps with Insider Buying
• High growth Tech and AI Companies
Or build your own from over 50 metrics.
Have feedback on this article? Concerned about the content? Get in touch with us directly. Alternatively, email editorial-team@simplywallst.com
About TSX:OR
OR Royalties
Acquires and manages precious metal and other royalties, streams, and other interests in Canada and internationally.
Excellent balance sheet with reasonable growth potential.
Similar Companies
Market Insights

Advertisement
Community Narratives
The company that turned a verb into a global necessity and basically runs the modern internet, digital ads, smartphones, maps, and AI.
Fair Value US$300.00|5.2% undervalued
OS
Community Contributor
Flowers Foods Pays A Fair Price For Health
Fair Value US$16.12|24.9% undervalued
NV
Community Contributor
TMX Group will thrive with 33.3% profit margin and enduring market moat
Fair Value CA$49.90|3.3% overvalued
LI
Community Contributor
The "Molecular Pencil": Why Beam's Technology is Built to Win
Fair Value US$65.01|64.5% undervalued
DA
Community Contributor