
Advertisement
- Canada
- /
- Metals and Mining
- /
- TSX:MDI
Declining Stock and Decent Financials: Is The Market Wrong About Major Drilling Group International Inc. (TSE:MDI)?
It is hard to get excited after looking at Major Drilling Group International's (TSE:MDI) recent performance, when its stock has declined 16% over the past week. However, stock prices are usually driven by a company’s financials over the long term, which in this case look pretty respectable. Particularly, we will be paying attention to Major Drilling Group International's ROE today.
Return on Equity or ROE is a test of how effectively a company is growing its value and managing investors’ money. In other words, it is a profitability ratio which measures the rate of return on the capital provided by the company's shareholders.
Check out our latest analysis for Major Drilling Group International
How Is ROE Calculated?
The formula for return on equity is:
Return on Equity = Net Profit (from continuing operations) ÷ Shareholders' Equity
So, based on the above formula, the ROE for Major Drilling Group International is:
9.2% = CA$47m ÷ CA$513m (Based on the trailing twelve months to July 2024).
The 'return' is the amount earned after tax over the last twelve months. So, this means that for every CA$1 of its shareholder's investments, the company generates a profit of CA$0.09.
What Is The Relationship Between ROE And Earnings Growth?
So far, we've learned that ROE is a measure of a company's profitability. Based on how much of its profits the company chooses to reinvest or "retain", we are then able to evaluate a company's future ability to generate profits. Assuming everything else remains unchanged, the higher the ROE and profit retention, the higher the growth rate of a company compared to companies that don't necessarily bear these characteristics.
Major Drilling Group International's Earnings Growth And 9.2% ROE
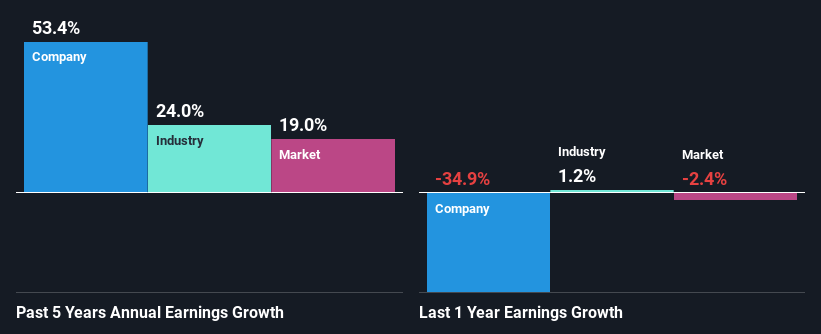
When you first look at it, Major Drilling Group International's ROE doesn't look that attractive. Yet, a closer study shows that the company's ROE is similar to the industry average of 9.2%. Looking at Major Drilling Group International's exceptional 53% five-year net income growth in particular, we are definitely impressed. Given the slightly low ROE, it is likely that there could be some other aspects that are driving this growth. For instance, the company has a low payout ratio or is being managed efficiently.
Next, on comparing with the industry net income growth, we found that Major Drilling Group International's growth is quite high when compared to the industry average growth of 24% in the same period, which is great to see.
The basis for attaching value to a company is, to a great extent, tied to its earnings growth. The investor should try to establish if the expected growth or decline in earnings, whichever the case may be, is priced in. Doing so will help them establish if the stock's future looks promising or ominous. If you're wondering about Major Drilling Group International's's valuation, check out this gauge of its price-to-earnings ratio, as compared to its industry.
Is Major Drilling Group International Using Its Retained Earnings Effectively?
Major Drilling Group International doesn't pay any regular dividends currently which essentially means that it has been reinvesting all of its profits into the business. This definitely contributes to the high earnings growth number that we discussed above.
Summary
In total, it does look like Major Drilling Group International has some positive aspects to its business. With a high rate of reinvestment, albeit at a low ROE, the company has managed to see a considerable growth in its earnings. With that said, the latest industry analyst forecasts reveal that the company's earnings growth is expected to slow down. Are these analysts expectations based on the broad expectations for the industry, or on the company's fundamentals? Click here to be taken to our analyst's forecasts page for the company.
New: Manage All Your Stock Portfolios in One Place
We've created the ultimate portfolio companion for stock investors, and it's free.
• Connect an unlimited number of Portfolios and see your total in one currency
• Be alerted to new Warning Signs or Risks via email or mobile
• Track the Fair Value of your stocks
Have feedback on this article? Concerned about the content? Get in touch with us directly. Alternatively, email editorial-team (at) simplywallst.com.
This article by Simply Wall St is general in nature. We provide commentary based on historical data and analyst forecasts only using an unbiased methodology and our articles are not intended to be financial advice. It does not constitute a recommendation to buy or sell any stock, and does not take account of your objectives, or your financial situation. We aim to bring you long-term focused analysis driven by fundamental data. Note that our analysis may not factor in the latest price-sensitive company announcements or qualitative material. Simply Wall St has no position in any stocks mentioned.
About TSX:MDI
Major Drilling Group International
Provides contract drilling services to mining and mineral exploration companies in the United States, Canada, South and Central America, Australasia, and Africa.
Flawless balance sheet with moderate growth potential.
Similar Companies
Market Insights

Advertisement
Community Narratives
MicroVision will explode future revenue by 380.37% with a vision towards success
Fair Value US$60.00|98.5% undervalued
TH
Community Contributor
The Indispensable Artery for a New North American Economy
Fair Value CA$132.87|2.3% undervalued
TI
Community Contributor