Advertisement
- Canada
- /
- Metals and Mining
- /
- TSX:III
Imperial Metals (TSX:III) Profitability Turnaround Reinforces Bullish Narratives on Valuation and Earnings Quality

Simply Wall St
Reviewed by Simply Wall St
Imperial Metals (TSX:III) has turned the corner to profitability, posting average annual earnings growth of 49.9% over the past five years. With a current share price of CA$6.33 and profit margins on the rise, the company stands out for its high-quality earnings and value metrics.
See our full analysis for Imperial Metals.Next up, we will see how these financials compare with the dominant market narratives. Some expectations may be reinforced, while others could face a reality check.
Curious how numbers become stories that shape markets? Explore Community Narratives
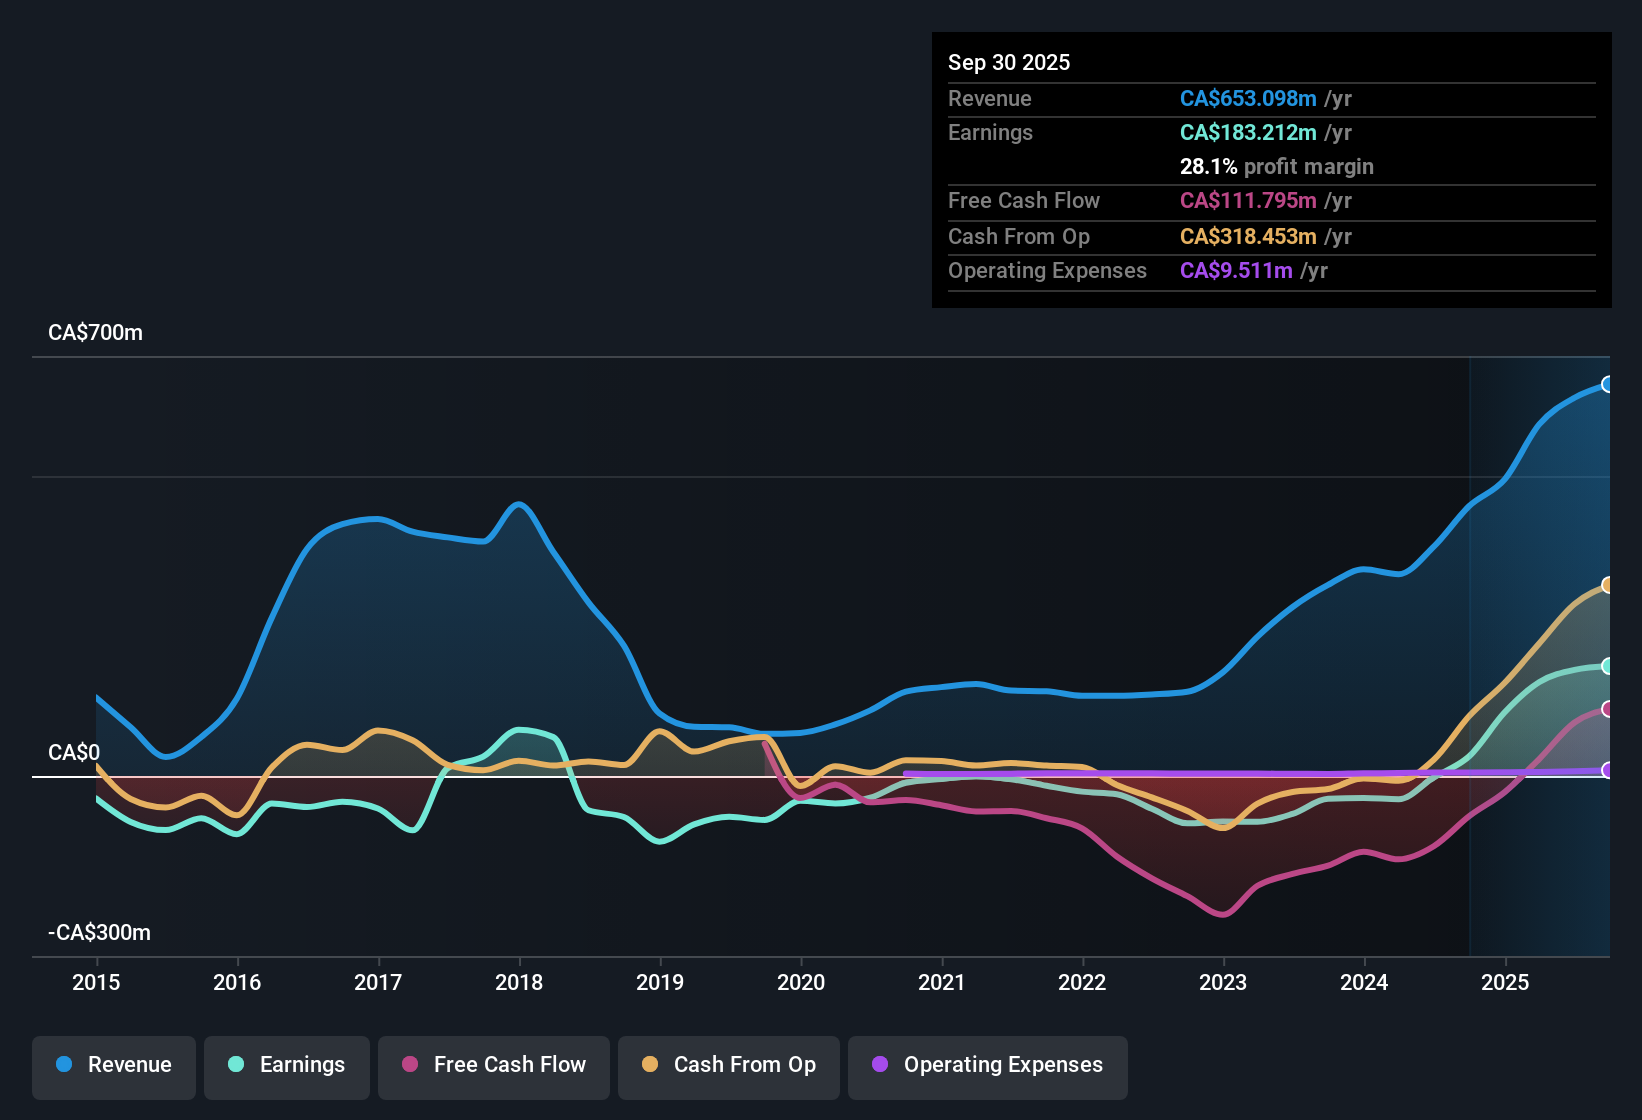
Margins Expand with Quality Profits
- Profit margins have widened due to Imperial Metals crossing into profitability after several years of net losses. This points to a structural shift in the business model as average annual earnings have grown by 49.9%.
- Market views highlight that achieving sustained profitability is not common for miners of Imperial’s size, and improved margins reinforce arguments that the quality of recent earnings is more robust than in prior years.
- Advocates for the business note that margin gains heavily support optimism, particularly since the earnings turnaround marks a significant departure from past trends.
- What is surprising is that few risk factors are flagged, suggesting earnings quality is not being undercut by one-off items or adjustments.
Valuation Gap Signals Relative Discount
- Imperial's current share price of CA$6.33 trades well below its DCF fair value of CA$8.77, and its price-to-earnings ratio of 6.4x is significantly lower than both the Canadian metals and mining industry average of 19.8x and the peer average of 35.6x. This points to a substantial valuation gap.
- With no major risk disclosures on record, the prevailing market view is that Imperial’s valuation could invite increased attention from bargain-seeking investors, especially when contrasted with industry norms.
- The sizable spread between the share price and DCF fair value creates a tension. Investors may wonder if discounted multiples reflect skepticism about the durability of recent profitability or lagging recognition by the market.
- The relative value case grows stronger since no flagged risk factors undermine the justification for a higher multiple.
High Earnings Growth Now Faces Sector Watch
- Annual average earnings growth of 49.9% sets Imperial apart, but the path forward will likely be scrutinized as sector peers evaluate if this pace can continue.
- The prevailing market view suggests that while sustained growth rates strengthen the bullish argument, future momentum still depends on sector trends and commodity prices.
- Momentum in the broader mining industry could either support or challenge Imperial’s earnings expansion. Recent sector optimism bodes well, but external shocks or price dips could quickly reverse sentiment.
- Given the absence of explicit risk commentary, investors' focus shifts toward how well Imperial’s results synchronize with larger industry cycles.
Next Steps
Don't just look at this quarter; the real story is in the long-term trend. We've done an in-depth analysis on Imperial Metals's growth and its valuation to see if today's price is a bargain. Add the company to your watchlist or portfolio now so you don't miss the next big move.
See What Else Is Out There
While Imperial's rapid earnings growth is impressive, its results may be vulnerable if sector momentum falters or industry cycles turn less favorable.
If you want companies whose steady expansion helps smooth out sector swings, use stable growth stocks screener (2074 results) to target businesses with proven performance across the market cycle.
This article by Simply Wall St is general in nature. We provide commentary based on historical data and analyst forecasts only using an unbiased methodology and our articles are not intended to be financial advice. It does not constitute a recommendation to buy or sell any stock, and does not take account of your objectives, or your financial situation. We aim to bring you long-term focused analysis driven by fundamental data. Note that our analysis may not factor in the latest price-sensitive company announcements or qualitative material. Simply Wall St has no position in any stocks mentioned.
New: AI Stock Screener & Alerts
Our new AI Stock Screener scans the market every day to uncover opportunities.
• Dividend Powerhouses (3%+ Yield)
• Undervalued Small Caps with Insider Buying
• High growth Tech and AI Companies
Or build your own from over 50 metrics.
Have feedback on this article? Concerned about the content? Get in touch with us directly. Alternatively, email editorial-team@simplywallst.com
About TSX:III
Imperial Metals
Engages in the exploration, development, and production of base and precious metals in the United States, Switzerland, China, the Philippines, Singapore, and Canada.
Good value with acceptable track record.
Market Insights

Advertisement
Community Narratives
The company that turned a verb into a global necessity and basically runs the modern internet, digital ads, smartphones, maps, and AI.
Fair Value US$300.00|5.2% undervalued
OS
Community Contributor
Flowers Foods Pays A Fair Price For Health
Fair Value US$16.12|24.9% undervalued
NV
Community Contributor
TMX Group will thrive with 33.3% profit margin and enduring market moat
Fair Value CA$49.90|3.3% overvalued
LI
Community Contributor
The "Molecular Pencil": Why Beam's Technology is Built to Win
Fair Value US$65.01|64.5% undervalued
DA
Community Contributor