
Advertisement
If you're looking for a multi-bagger, there's a few things to keep an eye out for. Firstly, we'd want to identify a growing return on capital employed (ROCE) and then alongside that, an ever-increasing base of capital employed. If you see this, it typically means it's a company with a great business model and plenty of profitable reinvestment opportunities. So when we looked at the ROCE trend of Foraco International (TSE:FAR) we really liked what we saw.
Understanding Return On Capital Employed (ROCE)
Just to clarify if you're unsure, ROCE is a metric for evaluating how much pre-tax income (in percentage terms) a company earns on the capital invested in its business. To calculate this metric for Foraco International, this is the formula:
Return on Capital Employed = Earnings Before Interest and Tax (EBIT) ÷ (Total Assets - Current Liabilities)
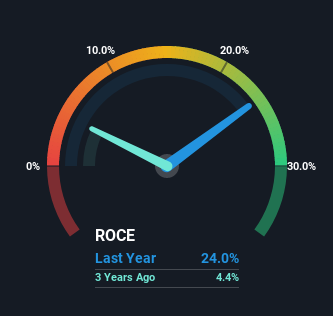
0.24 = US$39m ÷ (US$249m - US$88m) (Based on the trailing twelve months to September 2022).
So, Foraco International has an ROCE of 24%. In absolute terms that's a great return and it's even better than the Metals and Mining industry average of 2.4%.
See our latest analysis for Foraco International
Above you can see how the current ROCE for Foraco International compares to its prior returns on capital, but there's only so much you can tell from the past. If you're interested, you can view the analysts predictions in our free report on analyst forecasts for the company.
What Does the ROCE Trend For Foraco International Tell Us?
It's great to see that Foraco International has started to generate some pre-tax earnings from prior investments. The company was generating losses five years ago, but now it's turned around, earning 24% which is no doubt a relief for some early shareholders. In regards to capital employed, Foraco International is using 22% less capital than it was five years ago, which on the surface, can indicate that the business has become more efficient at generating these returns. This could potentially mean that the company is selling some of its assets.
For the record though, there was a noticeable increase in the company's current liabilities over the period, so we would attribute some of the ROCE growth to that. The current liabilities has increased to 35% of total assets, so the business is now more funded by the likes of its suppliers or short-term creditors. Keep an eye out for future increases because when the ratio of current liabilities to total assets gets particularly high, this can introduce some new risks for the business.
The Bottom Line On Foraco International's ROCE
In summary, it's great to see that Foraco International has been able to turn things around and earn higher returns on lower amounts of capital. Since the stock has returned a staggering 314% to shareholders over the last five years, it looks like investors are recognizing these changes. Therefore, we think it would be worth your time to check if these trends are going to continue.
If you'd like to know about the risks facing Foraco International, we've discovered 2 warning signs that you should be aware of.
If you want to search for more stocks that have been earning high returns, check out this free list of stocks with solid balance sheets that are also earning high returns on equity.
New: AI Stock Screener & Alerts
Our new AI Stock Screener scans the market every day to uncover opportunities.
• Dividend Powerhouses (3%+ Yield)
• Undervalued Small Caps with Insider Buying
• High growth Tech and AI Companies
Or build your own from over 50 metrics.
Have feedback on this article? Concerned about the content? Get in touch with us directly. Alternatively, email editorial-team (at) simplywallst.com.
This article by Simply Wall St is general in nature. We provide commentary based on historical data and analyst forecasts only using an unbiased methodology and our articles are not intended to be financial advice. It does not constitute a recommendation to buy or sell any stock, and does not take account of your objectives, or your financial situation. We aim to bring you long-term focused analysis driven by fundamental data. Note that our analysis may not factor in the latest price-sensitive company announcements or qualitative material. Simply Wall St has no position in any stocks mentioned.
About TSX:FAR
Foraco International
Provides drilling services in North America, South America, the Asia Pacific, the Middle East, Africa, and Europe.
Excellent balance sheet and good value.
Similar Companies
Market Insights

Advertisement
Community Narratives
MicroVision will explode future revenue by 380.37% with a vision towards success
Fair Value US$60.00|98.5% undervalued
TH
Community Contributor
The Indispensable Artery for a New North American Economy
Fair Value CA$132.87|2.3% undervalued
TI
Community Contributor