
Advertisement
Some say volatility, rather than debt, is the best way to think about risk as an investor, but Warren Buffett famously said that 'Volatility is far from synonymous with risk.' When we think about how risky a company is, we always like to look at its use of debt, since debt overload can lead to ruin. Importantly, Canfor Corporation (TSE:CFP) does carry debt. But the more important question is: how much risk is that debt creating?
What Risk Does Debt Bring?
Debt assists a business until the business has trouble paying it off, either with new capital or with free cash flow. Ultimately, if the company can't fulfill its legal obligations to repay debt, shareholders could walk away with nothing. However, a more common (but still painful) scenario is that it has to raise new equity capital at a low price, thus permanently diluting shareholders. Of course, plenty of companies use debt to fund growth, without any negative consequences. When we think about a company's use of debt, we first look at cash and debt together.
Check out our latest analysis for Canfor
What Is Canfor's Net Debt?
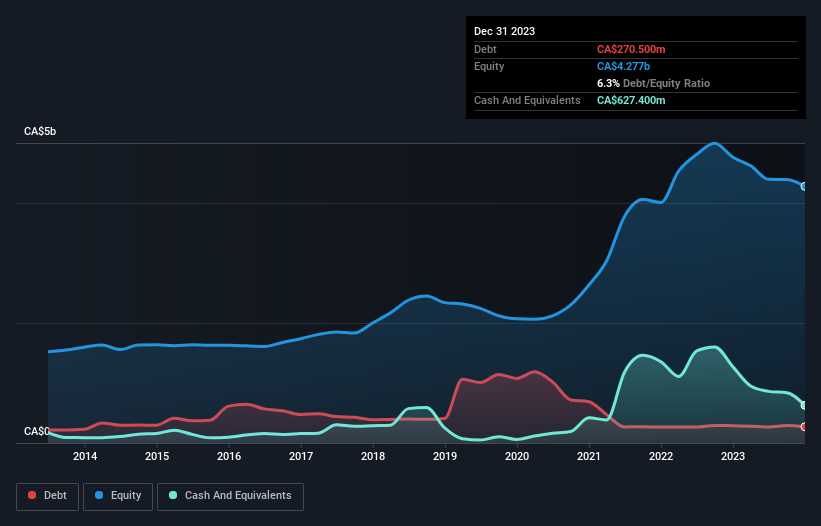
The image below, which you can click on for greater detail, shows that Canfor had debt of CA$270.5m at the end of December 2023, a reduction from CA$286.7m over a year. However, it does have CA$627.4m in cash offsetting this, leading to net cash of CA$356.9m.
How Healthy Is Canfor's Balance Sheet?
Zooming in on the latest balance sheet data, we can see that Canfor had liabilities of CA$905.2m due within 12 months and liabilities of CA$948.8m due beyond that. Offsetting these obligations, it had cash of CA$627.4m as well as receivables valued at CA$512.8m due within 12 months. So it has liabilities totalling CA$713.8m more than its cash and near-term receivables, combined.
Canfor has a market capitalization of CA$1.91b, so it could very likely raise cash to ameliorate its balance sheet, if the need arose. However, it is still worthwhile taking a close look at its ability to pay off debt. While it does have liabilities worth noting, Canfor also has more cash than debt, so we're pretty confident it can manage its debt safely. There's no doubt that we learn most about debt from the balance sheet. But it is future earnings, more than anything, that will determine Canfor's ability to maintain a healthy balance sheet going forward. So if you want to see what the professionals think, you might find this free report on analyst profit forecasts to be interesting.
Over 12 months, Canfor made a loss at the EBIT level, and saw its revenue drop to CA$5.4b, which is a fall of 27%. To be frank that doesn't bode well.
So How Risky Is Canfor?
We have no doubt that loss making companies are, in general, riskier than profitable ones. And we do note that Canfor had an earnings before interest and tax (EBIT) loss, over the last year. And over the same period it saw negative free cash outflow of CA$432m and booked a CA$326m accounting loss. Given it only has net cash of CA$356.9m, the company may need to raise more capital if it doesn't reach break-even soon. Overall, we'd say the stock is a bit risky, and we're usually very cautious until we see positive free cash flow. When we look at a riskier company, we like to check how their profits (or losses) are trending over time. Today, we're providing readers this interactive graph showing how Canfor's profit, revenue, and operating cashflow have changed over the last few years.
If you're interested in investing in businesses that can grow profits without the burden of debt, then check out this free list of growing businesses that have net cash on the balance sheet.
New: AI Stock Screener & Alerts
Our new AI Stock Screener scans the market every day to uncover opportunities.
• Dividend Powerhouses (3%+ Yield)
• Undervalued Small Caps with Insider Buying
• High growth Tech and AI Companies
Or build your own from over 50 metrics.
Have feedback on this article? Concerned about the content? Get in touch with us directly. Alternatively, email editorial-team (at) simplywallst.com.
This article by Simply Wall St is general in nature. We provide commentary based on historical data and analyst forecasts only using an unbiased methodology and our articles are not intended to be financial advice. It does not constitute a recommendation to buy or sell any stock, and does not take account of your objectives, or your financial situation. We aim to bring you long-term focused analysis driven by fundamental data. Note that our analysis may not factor in the latest price-sensitive company announcements or qualitative material. Simply Wall St has no position in any stocks mentioned.
About TSX:CFP
Canfor
Operates as an integrated forest products company in the United States, Asia, Canada, Europe, and internationally.
Good value with reasonable growth potential.
Similar Companies
Market Insights

Advertisement
Community Narratives
MicroVision will explode future revenue by 380.37% with a vision towards success
Fair Value US$60|98.4% undervalued
TH
Community Contributor
The Indispensable Artery for a New North American Economy
Fair Value CA$132.87|1.6% undervalued
TI
Community Contributor
Recently Updated Narratives
BE


Bejgal on MINISO Group Holding ·
MINISO's fair value is projected at 26.69 with an anticipated PE ratio shift of 20x
Fair Value:US$26.6928.0% undervalued
44 followersusers have followed this narrative
3 commentsusers have commented on this narrative
0 likesusers have liked this narrative
TI


TickerTickle on Oracle ·
The Quiet Giant That Became AI’s Power Grid
Fair Value:US$389.8149.5% undervalued
7 followersusers have followed this narrative
1 commentusers have commented on this narrative
0 likesusers have liked this narrative
AU

AuCA on Nova Ljubljanska Banka d.d ·
Nova Ljubljanska Banka d.d will expect a 11.2% revenue boost driving future growth
Fair Value:€20916.3% undervalued
23 followersusers have followed this narrative
3 commentsusers have commented on this narrative
0 likesusers have liked this narrative
Popular Narratives
OS


oscargarcia on Alphabet ·
The company that turned a verb into a global necessity and basically runs the modern internet, digital ads, smartphones, maps, and AI.
Fair Value:US$3404.9% undervalued
135 followersusers have followed this narrative
6 commentsusers have commented on this narrative
18 likesusers have liked this narrative
TH

TheWallstreetKing on MicroVision ·
MicroVision will explode future revenue by 380.37% with a vision towards success
Fair Value:US$6098.4% undervalued
86 followersusers have followed this narrative
11 commentsusers have commented on this narrative
18 likesusers have liked this narrative
AN


AnalystConsensusTarget on NVIDIA ·
NVDA: Expanding AI Demand Will Drive Major Data Center Investments Through 2026
Fair Value:US$232.7923.6% undervalued
923 followersusers have followed this narrative
5 commentsusers have commented on this narrative
22 likesusers have liked this narrative