

Key Insights
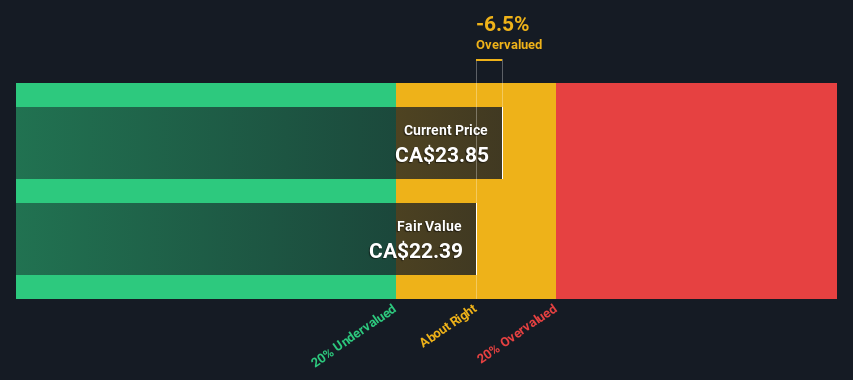
- The projected fair value for Barrick Gold is CA$22.39 based on 2 Stage Free Cash Flow to Equity
- Current share price of CA$23.85 suggests Barrick Gold is potentially trading close to its fair value
- Analyst price target for ABX is US$28.21, which is 26% above our fair value estimate
Today we will run through one way of estimating the intrinsic value of Barrick Gold Corporation (TSE:ABX) by taking the forecast future cash flows of the company and discounting them back to today's value. We will take advantage of the Discounted Cash Flow (DCF) model for this purpose. Believe it or not, it's not too difficult to follow, as you'll see from our example!
We generally believe that a company's value is the present value of all of the cash it will generate in the future. However, a DCF is just one valuation metric among many, and it is not without flaws. Anyone interested in learning a bit more about intrinsic value should have a read of the Simply Wall St analysis model.
View our latest analysis for Barrick Gold
What's The Estimated Valuation?
We use what is known as a 2-stage model, which simply means we have two different periods of growth rates for the company's cash flows. Generally the first stage is higher growth, and the second stage is a lower growth phase. In the first stage we need to estimate the cash flows to the business over the next ten years. Where possible we use analyst estimates, but when these aren't available we extrapolate the previous free cash flow (FCF) from the last estimate or reported value. We assume companies with shrinking free cash flow will slow their rate of shrinkage, and that companies with growing free cash flow will see their growth rate slow, over this period. We do this to reflect that growth tends to slow more in the early years than it does in later years.
Generally we assume that a dollar today is more valuable than a dollar in the future, so we discount the value of these future cash flows to their estimated value in today's dollars:
10-year free cash flow (FCF) forecast
| 2024 | 2025 | 2026 | 2027 | 2028 | 2029 | 2030 | 2031 | 2032 | 2033 | |
| Levered FCF ($, Millions) | US$1.82b | US$2.26b | US$1.74b | US$1.88b | US$1.86b | US$1.87b | US$1.88b | US$1.90b | US$1.92b | US$1.95b |
| Growth Rate Estimate Source | Analyst x13 | Analyst x9 | Analyst x2 | Analyst x1 | Est @ -0.68% | Est @ 0.10% | Est @ 0.65% | Est @ 1.03% | Est @ 1.30% | Est @ 1.49% |
| Present Value ($, Millions) Discounted @ 7.7% | US$1.7k | US$1.9k | US$1.4k | US$1.4k | US$1.3k | US$1.2k | US$1.1k | US$1.1k | US$989 | US$932 |
("Est" = FCF growth rate estimated by Simply Wall St)
Present Value of 10-year Cash Flow (PVCF) = US$13b
The second stage is also known as Terminal Value, this is the business's cash flow after the first stage. For a number of reasons a very conservative growth rate is used that cannot exceed that of a country's GDP growth. In this case we have used the 5-year average of the 10-year government bond yield (1.9%) to estimate future growth. In the same way as with the 10-year 'growth' period, we discount future cash flows to today's value, using a cost of equity of 7.7%.
Terminal Value (TV)= FCF2033 × (1 + g) ÷ (r – g) = US$2.0b× (1 + 1.9%) ÷ (7.7%– 1.9%) = US$35b
Present Value of Terminal Value (PVTV)= TV / (1 + r)10= US$35b÷ ( 1 + 7.7%)10= US$17b
The total value, or equity value, is then the sum of the present value of the future cash flows, which in this case is US$30b. The last step is to then divide the equity value by the number of shares outstanding. Relative to the current share price of CA$23.9, the company appears around fair value at the time of writing. The assumptions in any calculation have a big impact on the valuation, so it is better to view this as a rough estimate, not precise down to the last cent.
Important Assumptions
Now the most important inputs to a discounted cash flow are the discount rate, and of course, the actual cash flows. Part of investing is coming up with your own evaluation of a company's future performance, so try the calculation yourself and check your own assumptions. The DCF also does not consider the possible cyclicality of an industry, or a company's future capital requirements, so it does not give a full picture of a company's potential performance. Given that we are looking at Barrick Gold as potential shareholders, the cost of equity is used as the discount rate, rather than the cost of capital (or weighted average cost of capital, WACC) which accounts for debt. In this calculation we've used 7.7%, which is based on a levered beta of 1.145. Beta is a measure of a stock's volatility, compared to the market as a whole. We get our beta from the industry average beta of globally comparable companies, with an imposed limit between 0.8 and 2.0, which is a reasonable range for a stable business.
SWOT Analysis for Barrick Gold
- Debt is not viewed as a risk.
- Earnings declined over the past year.
- Dividend is low compared to the top 25% of dividend payers in the Metals and Mining market.
- Expensive based on P/S ratio and estimated fair value.
- Annual earnings are forecast to grow faster than the Canadian market.
- Significant insider buying over the past 3 months.
- Dividends are not covered by earnings and cashflows.
- Annual revenue is forecast to grow slower than the Canadian market.
Looking Ahead:
Valuation is only one side of the coin in terms of building your investment thesis, and it shouldn't be the only metric you look at when researching a company. It's not possible to obtain a foolproof valuation with a DCF model. Preferably you'd apply different cases and assumptions and see how they would impact the company's valuation. If a company grows at a different rate, or if its cost of equity or risk free rate changes sharply, the output can look very different. For Barrick Gold, we've compiled three further aspects you should assess:
- Risks: Consider for instance, the ever-present spectre of investment risk. We've identified 3 warning signs with Barrick Gold (at least 1 which is potentially serious) , and understanding these should be part of your investment process.
- Management:Have insiders been ramping up their shares to take advantage of the market's sentiment for ABX's future outlook? Check out our management and board analysis with insights on CEO compensation and governance factors.
- Other High Quality Alternatives: Do you like a good all-rounder? Explore our interactive list of high quality stocks to get an idea of what else is out there you may be missing!
PS. Simply Wall St updates its DCF calculation for every Canadian stock every day, so if you want to find the intrinsic value of any other stock just search here.
Valuation is complex, but we're here to simplify it.
Discover if Barrick Gold might be undervalued or overvalued with our detailed analysis, featuring fair value estimates, potential risks, dividends, insider trades, and its financial condition.
Access Free AnalysisHave feedback on this article? Concerned about the content? Get in touch with us directly. Alternatively, email editorial-team (at) simplywallst.com.
This article by Simply Wall St is general in nature. We provide commentary based on historical data and analyst forecasts only using an unbiased methodology and our articles are not intended to be financial advice. It does not constitute a recommendation to buy or sell any stock, and does not take account of your objectives, or your financial situation. We aim to bring you long-term focused analysis driven by fundamental data. Note that our analysis may not factor in the latest price-sensitive company announcements or qualitative material. Simply Wall St has no position in any stocks mentioned.
About TSX:ABX
Barrick Gold
Engages in the exploration, mine development, production, and sale of gold and copper properties in Canada and internationally.
Solid track record with excellent balance sheet and pays a dividend.
