
Advertisement
Are Robust Financials Driving The Recent Rally In Trisura Group Ltd.'s (TSE:TSU) Stock?
Most readers would already be aware that Trisura Group's (TSE:TSU) stock increased significantly by 6.9% over the past week. Given the company's impressive performance, we decided to study its financial indicators more closely as a company's financial health over the long-term usually dictates market outcomes. In this article, we decided to focus on Trisura Group's ROE.
ROE or return on equity is a useful tool to assess how effectively a company can generate returns on the investment it received from its shareholders. Simply put, it is used to assess the profitability of a company in relation to its equity capital.
View our latest analysis for Trisura Group
How To Calculate Return On Equity?
The formula for return on equity is:
Return on Equity = Net Profit (from continuing operations) ÷ Shareholders' Equity
So, based on the above formula, the ROE for Trisura Group is:
13% = CA$90m ÷ CA$695m (Based on the trailing twelve months to June 2024).
The 'return' refers to a company's earnings over the last year. That means that for every CA$1 worth of shareholders' equity, the company generated CA$0.13 in profit.
Why Is ROE Important For Earnings Growth?
We have already established that ROE serves as an efficient profit-generating gauge for a company's future earnings. Based on how much of its profits the company chooses to reinvest or "retain", we are then able to evaluate a company's future ability to generate profits. Assuming all else is equal, companies that have both a higher return on equity and higher profit retention are usually the ones that have a higher growth rate when compared to companies that don't have the same features.
A Side By Side comparison of Trisura Group's Earnings Growth And 13% ROE
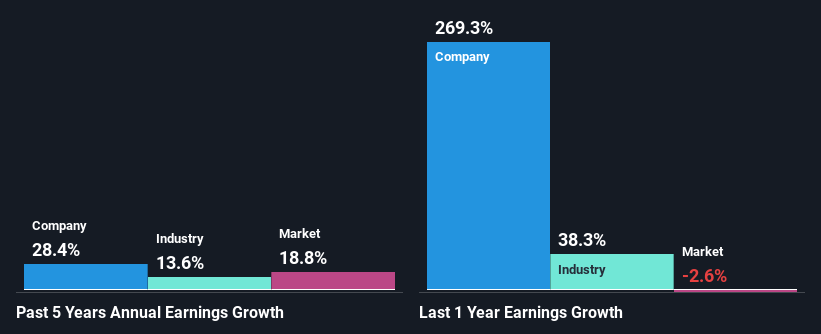
To begin with, Trisura Group seems to have a respectable ROE. And on comparing with the industry, we found that the the average industry ROE is similar at 13%. Consequently, this likely laid the ground for the impressive net income growth of 28% seen over the past five years by Trisura Group. We reckon that there could also be other factors at play here. For instance, the company has a low payout ratio or is being managed efficiently.
Next, on comparing with the industry net income growth, we found that Trisura Group's growth is quite high when compared to the industry average growth of 14% in the same period, which is great to see.
Earnings growth is an important metric to consider when valuing a stock. What investors need to determine next is if the expected earnings growth, or the lack of it, is already built into the share price. Doing so will help them establish if the stock's future looks promising or ominous. If you're wondering about Trisura Group's's valuation, check out this gauge of its price-to-earnings ratio, as compared to its industry.
Is Trisura Group Making Efficient Use Of Its Profits?
Given that Trisura Group doesn't pay any regular dividends to its shareholders, we infer that the company has been reinvesting all of its profits to grow its business.
Conclusion
In total, we are pretty happy with Trisura Group's performance. Specifically, we like that the company is reinvesting a huge chunk of its profits at a high rate of return. This of course has caused the company to see substantial growth in its earnings. The latest industry analyst forecasts show that the company is expected to maintain its current growth rate. Are these analysts expectations based on the broad expectations for the industry, or on the company's fundamentals? Click here to be taken to our analyst's forecasts page for the company.
Valuation is complex, but we're here to simplify it.
Discover if Trisura Group might be undervalued or overvalued with our detailed analysis, featuring fair value estimates, potential risks, dividends, insider trades, and its financial condition.
Access Free AnalysisHave feedback on this article? Concerned about the content? Get in touch with us directly. Alternatively, email editorial-team (at) simplywallst.com.
This article by Simply Wall St is general in nature. We provide commentary based on historical data and analyst forecasts only using an unbiased methodology and our articles are not intended to be financial advice. It does not constitute a recommendation to buy or sell any stock, and does not take account of your objectives, or your financial situation. We aim to bring you long-term focused analysis driven by fundamental data. Note that our analysis may not factor in the latest price-sensitive company announcements or qualitative material. Simply Wall St has no position in any stocks mentioned.
About TSX:TSU
Trisura Group
A specialty insurance company, operates in the surety, warranty, corporate insurance, and program and fronting businesses in Canada and the United States.
Proven track record with adequate balance sheet.
Similar Companies
Market Insights

Advertisement
Community Narratives
MicroVision will explode future revenue by 380.37% with a vision towards success
Fair Value US$60.00|98.4% undervalued
TH
Community Contributor
The Indispensable Artery for a New North American Economy
Fair Value CA$132.87|1.3% undervalued
TI
Community Contributor