Stock Analysis
Manulife Financial's (TSE:MFC) investors will be pleased with their respectable 98% return over the last five years


Stock pickers are generally looking for stocks that will outperform the broader market. And in our experience, buying the right stocks can give your wealth a significant boost. For example, the Manulife Financial Corporation (TSE:MFC) share price is up 53% in the last 5 years, clearly besting the market return of around 39% (ignoring dividends). However, more recent returns haven't been as impressive as that, with the stock returning just 44% in the last year, including dividends.
So let's investigate and see if the longer term performance of the company has been in line with the underlying business' progress.
View our latest analysis for Manulife Financial
There is no denying that markets are sometimes efficient, but prices do not always reflect underlying business performance. One way to examine how market sentiment has changed over time is to look at the interaction between a company's share price and its earnings per share (EPS).
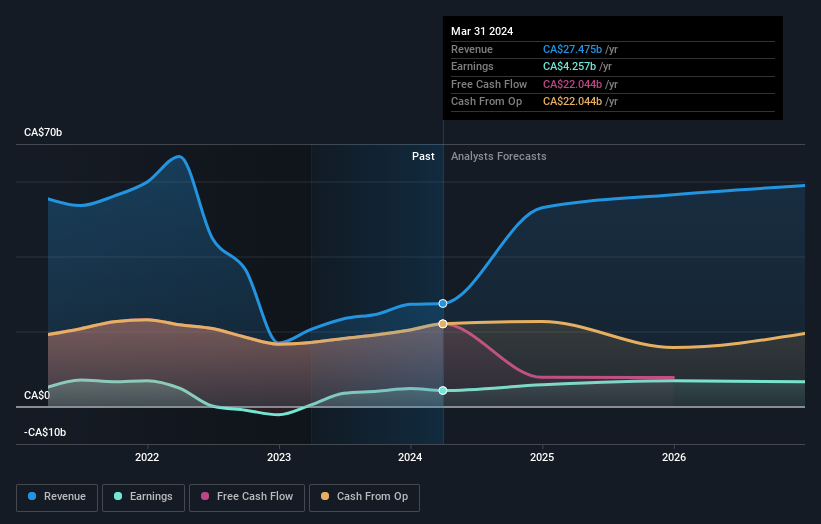
During five years of share price growth, Manulife Financial actually saw its EPS drop 2.9% per year.
So it's hard to argue that the earnings per share are the best metric to judge the company, as it may not be optimized for profits at this point. Therefore, it's worth taking a look at other metrics to try to understand the share price movements.
We note that the dividend is higher than it was previously - always nice to see. Maybe dividend investors have helped support the share price.
The image below shows how earnings and revenue have tracked over time (if you click on the image you can see greater detail).
We consider it positive that insiders have made significant purchases in the last year. Having said that, most people consider earnings and revenue growth trends to be a more meaningful guide to the business. This free report showing analyst forecasts should help you form a view on Manulife Financial
What About Dividends?
It is important to consider the total shareholder return, as well as the share price return, for any given stock. Whereas the share price return only reflects the change in the share price, the TSR includes the value of dividends (assuming they were reinvested) and the benefit of any discounted capital raising or spin-off. Arguably, the TSR gives a more comprehensive picture of the return generated by a stock. As it happens, Manulife Financial's TSR for the last 5 years was 98%, which exceeds the share price return mentioned earlier. The dividends paid by the company have thusly boosted the total shareholder return.
A Different Perspective
We're pleased to report that Manulife Financial shareholders have received a total shareholder return of 44% over one year. Of course, that includes the dividend. Since the one-year TSR is better than the five-year TSR (the latter coming in at 15% per year), it would seem that the stock's performance has improved in recent times. In the best case scenario, this may hint at some real business momentum, implying that now could be a great time to delve deeper. It's always interesting to track share price performance over the longer term. But to understand Manulife Financial better, we need to consider many other factors. For instance, we've identified 1 warning sign for Manulife Financial that you should be aware of.
If you like to buy stocks alongside management, then you might just love this free list of companies. (Hint: most of them are flying under the radar).
Please note, the market returns quoted in this article reflect the market weighted average returns of stocks that currently trade on Canadian exchanges.
Valuation is complex, but we're helping make it simple.
Find out whether Manulife Financial is potentially over or undervalued by checking out our comprehensive analysis, which includes fair value estimates, risks and warnings, dividends, insider transactions and financial health.
View the Free AnalysisHave feedback on this article? Concerned about the content? Get in touch with us directly. Alternatively, email editorial-team (at) simplywallst.com.
This article by Simply Wall St is general in nature. We provide commentary based on historical data and analyst forecasts only using an unbiased methodology and our articles are not intended to be financial advice. It does not constitute a recommendation to buy or sell any stock, and does not take account of your objectives, or your financial situation. We aim to bring you long-term focused analysis driven by fundamental data. Note that our analysis may not factor in the latest price-sensitive company announcements or qualitative material. Simply Wall St has no position in any stocks mentioned.
About TSX:MFC
Manulife Financial
Provides financial products and services in the United States, Canada, Asia, and internationally.
Established dividend payer with proven track record.
