
Advertisement
- Canada
- /
- Personal Products
- /
- TSX:MAV
Returns On Capital Are Showing Encouraging Signs At MAV Beauty Brands (TSE:MAV)
Did you know there are some financial metrics that can provide clues of a potential multi-bagger? Firstly, we'd want to identify a growing return on capital employed (ROCE) and then alongside that, an ever-increasing base of capital employed. This shows us that it's a compounding machine, able to continually reinvest its earnings back into the business and generate higher returns. So when we looked at MAV Beauty Brands (TSE:MAV) and its trend of ROCE, we really liked what we saw.
Understanding Return On Capital Employed (ROCE)
For those who don't know, ROCE is a measure of a company's yearly pre-tax profit (its return), relative to the capital employed in the business. The formula for this calculation on MAV Beauty Brands is:
Return on Capital Employed = Earnings Before Interest and Tax (EBIT) ÷ (Total Assets - Current Liabilities)
0.049 = US$5.1m ÷ (US$120m - US$17m) (Based on the trailing twelve months to March 2023).
So, MAV Beauty Brands has an ROCE of 4.9%. Ultimately, that's a low return and it under-performs the Personal Products industry average of 13%.
View our latest analysis for MAV Beauty Brands
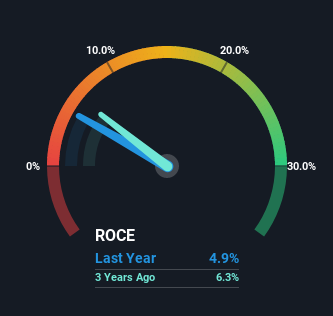
Above you can see how the current ROCE for MAV Beauty Brands compares to its prior returns on capital, but there's only so much you can tell from the past. If you'd like to see what analysts are forecasting going forward, you should check out our free report for MAV Beauty Brands.
SWOT Analysis for MAV Beauty Brands
Strength
- No major strengths identified for MAV.
Weakness
- Interest payments on debt are not well covered.
- Expensive based on P/S ratio and estimated fair value.
Opportunity
- Has sufficient cash runway for more than 3 years based on current free cash flows.
Threat
- Debt is not well covered by operating cash flow.
- Total liabilities exceed total assets, which raises the risk of financial distress.
The Trend Of ROCE
It's nice to see that ROCE is headed in the right direction, even if it is still relatively low. We found that the returns on capital employed over the last five years have risen by 21%. That's a very favorable trend because this means that the company is earning more per dollar of capital that's being employed. Interestingly, the business may be becoming more efficient because it's applying 68% less capital than it was five years ago. A business that's shrinking its asset base like this isn't usually typical of a soon to be multi-bagger company.
In Conclusion...
In summary, it's great to see that MAV Beauty Brands has been able to turn things around and earn higher returns on lower amounts of capital. Although the company may be facing some issues elsewhere since the stock has plunged 92% in the last three years. Regardless, we think the underlying fundamentals warrant this stock for further investigation.
MAV Beauty Brands does have some risks though, and we've spotted 4 warning signs for MAV Beauty Brands that you might be interested in.
While MAV Beauty Brands may not currently earn the highest returns, we've compiled a list of companies that currently earn more than 25% return on equity. Check out this free list here.
New: AI Stock Screener & Alerts
Our new AI Stock Screener scans the market every day to uncover opportunities.
• Dividend Powerhouses (3%+ Yield)
• Undervalued Small Caps with Insider Buying
• High growth Tech and AI Companies
Or build your own from over 50 metrics.
Have feedback on this article? Concerned about the content? Get in touch with us directly. Alternatively, email editorial-team (at) simplywallst.com.
This article by Simply Wall St is general in nature. We provide commentary based on historical data and analyst forecasts only using an unbiased methodology and our articles are not intended to be financial advice. It does not constitute a recommendation to buy or sell any stock, and does not take account of your objectives, or your financial situation. We aim to bring you long-term focused analysis driven by fundamental data. Note that our analysis may not factor in the latest price-sensitive company announcements or qualitative material. Simply Wall St has no position in any stocks mentioned.
About TSX:MAV
Old MAV Wind-Down
Old MAV Wind-Down Ltd. operates as a personal care company worldwide.
Good value with imperfect balance sheet.
Market Insights

Advertisement
Community Narratives
MicroVision will explode future revenue by 380.37% with a vision towards success
Fair Value US$60.00|98.4% undervalued
TH
Community Contributor
The Indispensable Artery for a New North American Economy
Fair Value CA$132.87|3.6% undervalued
TI
Community Contributor