
Advertisement
Some say volatility, rather than debt, is the best way to think about risk as an investor, but Warren Buffett famously said that 'Volatility is far from synonymous with risk.' It's only natural to consider a company's balance sheet when you examine how risky it is, since debt is often involved when a business collapses. Importantly, Nanalysis Scientific Corp. (CVE:NSCI) does carry debt. But the real question is whether this debt is making the company risky.
What Risk Does Debt Bring?
Generally speaking, debt only becomes a real problem when a company can't easily pay it off, either by raising capital or with its own cash flow. In the worst case scenario, a company can go bankrupt if it cannot pay its creditors. However, a more frequent (but still costly) occurrence is where a company must issue shares at bargain-basement prices, permanently diluting shareholders, just to shore up its balance sheet. Having said that, the most common situation is where a company manages its debt reasonably well - and to its own advantage. When we examine debt levels, we first consider both cash and debt levels, together.
See our latest analysis for Nanalysis Scientific
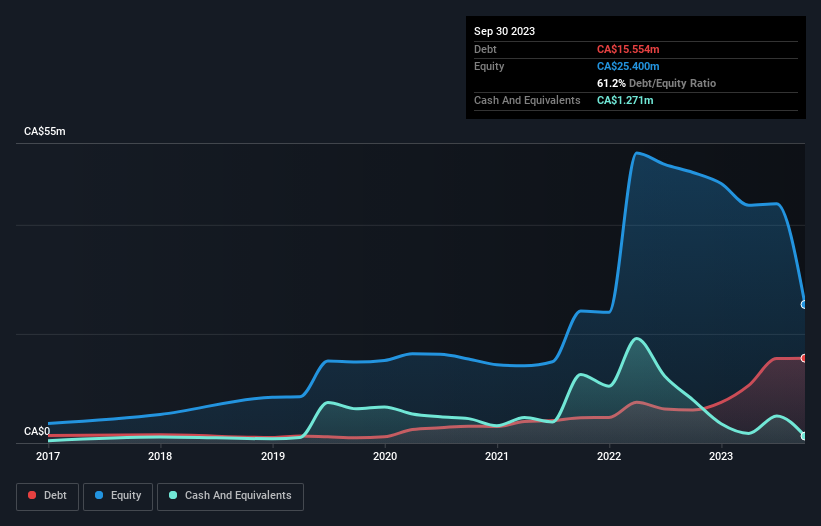
What Is Nanalysis Scientific's Net Debt?
As you can see below, at the end of September 2023, Nanalysis Scientific had CA$15.6m of debt, up from CA$6.05m a year ago. Click the image for more detail. However, because it has a cash reserve of CA$1.27m, its net debt is less, at about CA$14.3m.
How Strong Is Nanalysis Scientific's Balance Sheet?
According to the last reported balance sheet, Nanalysis Scientific had liabilities of CA$10.8m due within 12 months, and liabilities of CA$16.4m due beyond 12 months. On the other hand, it had cash of CA$1.27m and CA$6.47m worth of receivables due within a year. So its liabilities total CA$19.4m more than the combination of its cash and short-term receivables.
While this might seem like a lot, it is not so bad since Nanalysis Scientific has a market capitalization of CA$41.8m, and so it could probably strengthen its balance sheet by raising capital if it needed to. But we definitely want to keep our eyes open to indications that its debt is bringing too much risk. The balance sheet is clearly the area to focus on when you are analysing debt. But it is Nanalysis Scientific's earnings that will influence how the balance sheet holds up in the future. So if you're keen to discover more about its earnings, it might be worth checking out this graph of its long term earnings trend.
In the last year Nanalysis Scientific wasn't profitable at an EBIT level, but managed to grow its revenue by 14%, to CA$26m. That rate of growth is a bit slow for our taste, but it takes all types to make a world.
Caveat Emptor
Over the last twelve months Nanalysis Scientific produced an earnings before interest and tax (EBIT) loss. Indeed, it lost a very considerable CA$16m at the EBIT level. When we look at that and recall the liabilities on its balance sheet, relative to cash, it seems unwise to us for the company to have any debt. So we think its balance sheet is a little strained, though not beyond repair. Another cause for caution is that is bled CA$18m in negative free cash flow over the last twelve months. So in short it's a really risky stock. There's no doubt that we learn most about debt from the balance sheet. However, not all investment risk resides within the balance sheet - far from it. Be aware that Nanalysis Scientific is showing 4 warning signs in our investment analysis , and 2 of those can't be ignored...
If you're interested in investing in businesses that can grow profits without the burden of debt, then check out this free list of growing businesses that have net cash on the balance sheet.
Valuation is complex, but we're here to simplify it.
Discover if Nanalysis Scientific might be undervalued or overvalued with our detailed analysis, featuring fair value estimates, potential risks, dividends, insider trades, and its financial condition.
Access Free AnalysisHave feedback on this article? Concerned about the content? Get in touch with us directly. Alternatively, email editorial-team (at) simplywallst.com.
This article by Simply Wall St is general in nature. We provide commentary based on historical data and analyst forecasts only using an unbiased methodology and our articles are not intended to be financial advice. It does not constitute a recommendation to buy or sell any stock, and does not take account of your objectives, or your financial situation. We aim to bring you long-term focused analysis driven by fundamental data. Note that our analysis may not factor in the latest price-sensitive company announcements or qualitative material. Simply Wall St has no position in any stocks mentioned.
About TSXV:NSCI
Nanalysis Scientific
Develops, manufactures, and sells magnetic resonance technology products in Canada, the United States, Europe, Asia, and internationally.
Mediocre balance sheet and slightly overvalued.
Similar Companies
Market Insights

Advertisement
Community Narratives
The company that turned a verb into a global necessity and basically runs the modern internet, digital ads, smartphones, maps, and AI.
Fair Value US$300.00|6.2% undervalued
OS
Community Contributor
Flowers Foods Pays A Fair Price For Health
Fair Value US$16.12|25.1% undervalued
NV
Community Contributor
TMX Group will thrive with 33.3% profit margin and enduring market moat
Fair Value CA$49.90|0.04% overvalued
LI
Community Contributor