
The external fund manager backed by Berkshire Hathaway's Charlie Munger, Li Lu, makes no bones about it when he says 'The biggest investment risk is not the volatility of prices, but whether you will suffer a permanent loss of capital.' So it seems the smart money knows that debt - which is usually involved in bankruptcies - is a very important factor, when you assess how risky a company is. As with many other companies kneat.com, inc. (TSE:KSI) makes use of debt. But the more important question is: how much risk is that debt creating?
What Risk Does Debt Bring?
Debt assists a business until the business has trouble paying it off, either with new capital or with free cash flow. Ultimately, if the company can't fulfill its legal obligations to repay debt, shareholders could walk away with nothing. While that is not too common, we often do see indebted companies permanently diluting shareholders because lenders force them to raise capital at a distressed price. Of course, plenty of companies use debt to fund growth, without any negative consequences. When we think about a company's use of debt, we first look at cash and debt together.
Check out our latest analysis for kneat.com
What Is kneat.com's Net Debt?
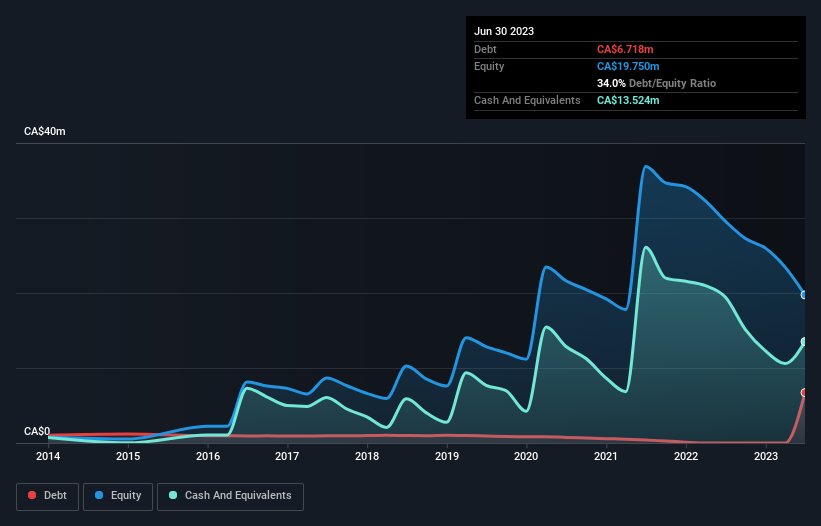
The image below, which you can click on for greater detail, shows that at June 2023 kneat.com had debt of CA$6.72m, up from none in one year. But it also has CA$13.5m in cash to offset that, meaning it has CA$6.81m net cash.
A Look At kneat.com's Liabilities
Zooming in on the latest balance sheet data, we can see that kneat.com had liabilities of CA$21.4m due within 12 months and liabilities of CA$13.1m due beyond that. On the other hand, it had cash of CA$13.5m and CA$6.99m worth of receivables due within a year. So its liabilities outweigh the sum of its cash and (near-term) receivables by CA$14.0m.
Of course, kneat.com has a market capitalization of CA$229.9m, so these liabilities are probably manageable. Having said that, it's clear that we should continue to monitor its balance sheet, lest it change for the worse. Despite its noteworthy liabilities, kneat.com boasts net cash, so it's fair to say it does not have a heavy debt load! There's no doubt that we learn most about debt from the balance sheet. But it is future earnings, more than anything, that will determine kneat.com's ability to maintain a healthy balance sheet going forward. So if you're focused on the future you can check out this free report showing analyst profit forecasts.
In the last year kneat.com wasn't profitable at an EBIT level, but managed to grow its revenue by 40%, to CA$29m. With any luck the company will be able to grow its way to profitability.
So How Risky Is kneat.com?
Statistically speaking companies that lose money are riskier than those that make money. And the fact is that over the last twelve months kneat.com lost money at the earnings before interest and tax (EBIT) line. Indeed, in that time it burnt through CA$12m of cash and made a loss of CA$10.0m. But at least it has CA$6.81m on the balance sheet to spend on growth, near-term. kneat.com's revenue growth shone bright over the last year, so it may well be in a position to turn a profit in due course. By investing before those profits, shareholders take on more risk in the hope of bigger rewards. The balance sheet is clearly the area to focus on when you are analysing debt. However, not all investment risk resides within the balance sheet - far from it. Be aware that kneat.com is showing 4 warning signs in our investment analysis , and 2 of those are a bit unpleasant...
If, after all that, you're more interested in a fast growing company with a rock-solid balance sheet, then check out our list of net cash growth stocks without delay.
The New Payments ETF Is Live on NASDAQ:
Money is moving to real-time rails, and a newly listed ETF now gives investors direct exposure. Fast settlement. Institutional custody. Simple access.
Explore how this launch could reshape portfolios
Sponsored ContentNew: Manage All Your Stock Portfolios in One Place
We've created the ultimate portfolio companion for stock investors, and it's free.
• Connect an unlimited number of Portfolios and see your total in one currency
• Be alerted to new Warning Signs or Risks via email or mobile
• Track the Fair Value of your stocks
Have feedback on this article? Concerned about the content? Get in touch with us directly. Alternatively, email editorial-team (at) simplywallst.com.
This article by Simply Wall St is general in nature. We provide commentary based on historical data and analyst forecasts only using an unbiased methodology and our articles are not intended to be financial advice. It does not constitute a recommendation to buy or sell any stock, and does not take account of your objectives, or your financial situation. We aim to bring you long-term focused analysis driven by fundamental data. Note that our analysis may not factor in the latest price-sensitive company announcements or qualitative material. Simply Wall St has no position in any stocks mentioned.
About TSX:KSI
kneat.com
Designs, develops, and supplies software for data and document management within regulated environments in North America, Europe, and the Asia Pacific.
High growth potential and good value.
Market Insights

Weekly Picks

Early mover in a fast growing industry. Likely to experience share price volatility as they scale


A case for CA$31.80 (undiluted), aka 8,616% upside from CA$0.37 (an 86 bagger!).


Moderation and Stabilisation: HOLD: Fair Price based on a 4-year Cycle is $12.08
Recently Updated Narratives

Airbnb Stock: Platform Growth in a World of Saturation and Scrutiny

Adobe Stock: AI-Fueled ARR Growth Pushes Guidance Higher, But Cost Pressures Loom

Thomson Reuters Stock: When Legal Intelligence Becomes Mission-Critical Infrastructure
Popular Narratives


Crazy Undervalued 42 Baggers Silver Play (Active & Running Mine)


NVDA: Expanding AI Demand Will Drive Major Data Center Investments Through 2026

The AI Infrastructure Giant Grows Into Its Valuation
Trending Discussion


