- Canada
- /
- Oil and Gas
- /
- TSXV:SNM
ShaMaran Petroleum Corp. (CVE:SNM) Stock Rockets 44% But Many Are Still Ignoring The Company

The ShaMaran Petroleum Corp. (CVE:SNM) share price has done very well over the last month, posting an excellent gain of 44%. Not all shareholders will be feeling jubilant, since the share price is still down a very disappointing 19% in the last twelve months.
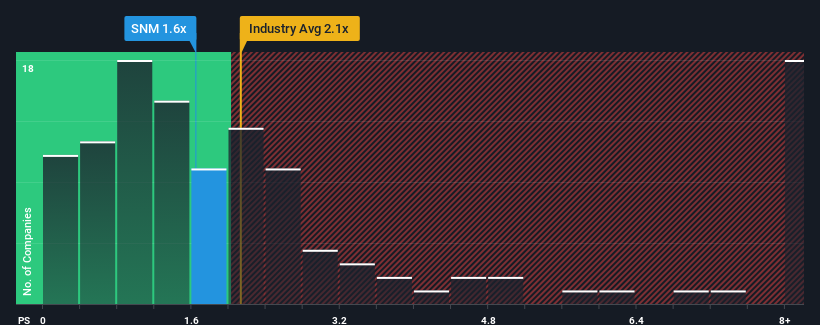
In spite of the firm bounce in price, there still wouldn't be many who think ShaMaran Petroleum's price-to-sales (or "P/S") ratio of 1.6x is worth a mention when the median P/S in Canada's Oil and Gas industry is similar at about 2.1x. However, investors might be overlooking a clear opportunity or potential setback if there is no rational basis for the P/S.
View our latest analysis for ShaMaran Petroleum
How ShaMaran Petroleum Has Been Performing
ShaMaran Petroleum could be doing better as its revenue has been going backwards lately while most other companies have been seeing positive revenue growth. Perhaps the market is expecting its poor revenue performance to improve, keeping the P/S from dropping. If not, then existing shareholders may be a little nervous about the viability of the share price.
If you'd like to see what analysts are forecasting going forward, you should check out our free report on ShaMaran Petroleum.How Is ShaMaran Petroleum's Revenue Growth Trending?
ShaMaran Petroleum's P/S ratio would be typical for a company that's only expected to deliver moderate growth, and importantly, perform in line with the industry.
Taking a look back first, the company's revenue growth last year wasn't something to get excited about as it posted a disappointing decline of 53%. Still, the latest three year period has seen an excellent 46% overall rise in revenue, in spite of its unsatisfying short-term performance. So we can start by confirming that the company has generally done a very good job of growing revenue over that time, even though it had some hiccups along the way.
Looking ahead now, revenue is anticipated to climb by 36% per year during the coming three years according to the dual analysts following the company. With the industry only predicted to deliver 8.5% per year, the company is positioned for a stronger revenue result.
With this information, we find it interesting that ShaMaran Petroleum is trading at a fairly similar P/S compared to the industry. It may be that most investors aren't convinced the company can achieve future growth expectations.
What Does ShaMaran Petroleum's P/S Mean For Investors?
Its shares have lifted substantially and now ShaMaran Petroleum's P/S is back within range of the industry median. Generally, our preference is to limit the use of the price-to-sales ratio to establishing what the market thinks about the overall health of a company.
Looking at ShaMaran Petroleum's analyst forecasts revealed that its superior revenue outlook isn't giving the boost to its P/S that we would've expected. When we see a strong revenue outlook, with growth outpacing the industry, we can only assume potential uncertainty around these figures are what might be placing slight pressure on the P/S ratio. It appears some are indeed anticipating revenue instability, because these conditions should normally provide a boost to the share price.
Plus, you should also learn about this 1 warning sign we've spotted with ShaMaran Petroleum.
If these risks are making you reconsider your opinion on ShaMaran Petroleum, explore our interactive list of high quality stocks to get an idea of what else is out there.
Mobile Infrastructure for Defense and Disaster
The next wave in robotics isn't humanoid. Its fully autonomous towers delivering 5G, ISR, and radar in under 30 minutes, anywhere.
Get the investor briefing before the next round of contracts
Sponsored On Behalf of CiTechNew: Manage All Your Stock Portfolios in One Place
We've created the ultimate portfolio companion for stock investors, and it's free.
• Connect an unlimited number of Portfolios and see your total in one currency
• Be alerted to new Warning Signs or Risks via email or mobile
• Track the Fair Value of your stocks
Have feedback on this article? Concerned about the content? Get in touch with us directly. Alternatively, email editorial-team (at) simplywallst.com.
This article by Simply Wall St is general in nature. We provide commentary based on historical data and analyst forecasts only using an unbiased methodology and our articles are not intended to be financial advice. It does not constitute a recommendation to buy or sell any stock, and does not take account of your objectives, or your financial situation. We aim to bring you long-term focused analysis driven by fundamental data. Note that our analysis may not factor in the latest price-sensitive company announcements or qualitative material. Simply Wall St has no position in any stocks mentioned.
About TSXV:SNM
ShaMaran Petroleum
Engages in the oil and gas exploration and production.
Reasonable growth potential with adequate balance sheet.
Similar Companies
Market Insights

Weekly Picks

Early mover in a fast growing industry. Likely to experience share price volatility as they scale


A case for CA$31.80 (undiluted), aka 8,616% upside from CA$0.37 (an 86 bagger!).


Moderation and Stabilisation: HOLD: Fair Price based on a 4-year Cycle is $12.08
Recently Updated Narratives

Automotive Electronics Manufacturer Consistent and Stable

Airbnb Stock: Platform Growth in a World of Saturation and Scrutiny

Adobe Stock: AI-Fueled ARR Growth Pushes Guidance Higher, But Cost Pressures Loom
Popular Narratives


Crazy Undervalued 42 Baggers Silver Play (Active & Running Mine)


NVDA: Expanding AI Demand Will Drive Major Data Center Investments Through 2026

The AI Infrastructure Giant Grows Into Its Valuation
Trending Discussion


