- Canada
- /
- Oil and Gas
- /
- TSXV:CWV
Market Cool On Crown Point Energy Inc.'s (CVE:CWV) Revenues Pushing Shares 39% Lower
Crown Point Energy Inc. (CVE:CWV) shares have retraced a considerable 39% in the last month, reversing a fair amount of their solid recent performance. Instead of being rewarded, shareholders who have already held through the last twelve months are now sitting on a 27% share price drop.
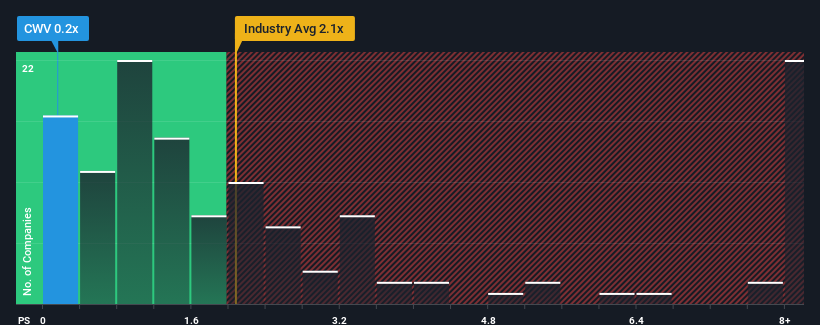
After such a large drop in price, Crown Point Energy's price-to-sales (or "P/S") ratio of 0.2x might make it look like a buy right now compared to the Oil and Gas industry in Canada, where around half of the companies have P/S ratios above 2.1x and even P/S above 7x are quite common. Nonetheless, we'd need to dig a little deeper to determine if there is a rational basis for the reduced P/S.
Check out our latest analysis for Crown Point Energy

How Crown Point Energy Has Been Performing
For instance, Crown Point Energy's receding revenue in recent times would have to be some food for thought. Perhaps the market believes the recent revenue performance isn't good enough to keep up the industry, causing the P/S ratio to suffer. If you like the company, you'd be hoping this isn't the case so that you could potentially pick up some stock while it's out of favour.
Want the full picture on earnings, revenue and cash flow for the company? Then our free report on Crown Point Energy will help you shine a light on its historical performance.Is There Any Revenue Growth Forecasted For Crown Point Energy?
There's an inherent assumption that a company should underperform the industry for P/S ratios like Crown Point Energy's to be considered reasonable.
Taking a look back first, the company's revenue growth last year wasn't something to get excited about as it posted a disappointing decline of 24%. Unfortunately, that's brought it right back to where it started three years ago with revenue growth being virtually non-existent overall during that time. Therefore, it's fair to say that revenue growth has been inconsistent recently for the company.
Comparing that to the industry, which is predicted to deliver 1.1% growth in the next 12 months, the company's momentum is pretty similar based on recent medium-term annualised revenue results.
In light of this, it's peculiar that Crown Point Energy's P/S sits below the majority of other companies. Apparently some shareholders are more bearish than recent times would indicate and have been accepting lower selling prices.
The Key Takeaway
Crown Point Energy's P/S has taken a dip along with its share price. It's argued the price-to-sales ratio is an inferior measure of value within certain industries, but it can be a powerful business sentiment indicator.
The fact that Crown Point Energy currently trades at a low P/S relative to the industry is unexpected considering its recent three-year growth is in line with the wider industry forecast. When we see industry-like revenue growth but a lower than expected P/S, we assume potential risks are what might be placing downward pressure on the share price. revenue trends suggest that the risk of a price decline is low, investors appear to perceive a possibility of revenue volatility in the future.
You should always think about risks. Case in point, we've spotted 4 warning signs for Crown Point Energy you should be aware of.
If you're unsure about the strength of Crown Point Energy's business, why not explore our interactive list of stocks with solid business fundamentals for some other companies you may have missed.
New: AI Stock Screener & Alerts
Our new AI Stock Screener scans the market every day to uncover opportunities.
• Dividend Powerhouses (3%+ Yield)
• Undervalued Small Caps with Insider Buying
• High growth Tech and AI Companies
Or build your own from over 50 metrics.
Have feedback on this article? Concerned about the content? Get in touch with us directly. Alternatively, email editorial-team (at) simplywallst.com.
This article by Simply Wall St is general in nature. We provide commentary based on historical data and analyst forecasts only using an unbiased methodology and our articles are not intended to be financial advice. It does not constitute a recommendation to buy or sell any stock, and does not take account of your objectives, or your financial situation. We aim to bring you long-term focused analysis driven by fundamental data. Note that our analysis may not factor in the latest price-sensitive company announcements or qualitative material. Simply Wall St has no position in any stocks mentioned.
About TSXV:CWV
Crown Point Energy
A junior international oil and gas company, explores for, develops, and produces petroleum and natural gas properties.
Slight risk and slightly overvalued.
Similar Companies
Market Insights
Community Narratives


