
Advertisement
- Canada
- /
- Oil and Gas
- /
- TSXV:CWV
Market Cool On Crown Point Energy Inc.'s (CVE:CWV) Revenues Pushing Shares 35% Lower
Crown Point Energy Inc. (CVE:CWV) shareholders won't be pleased to see that the share price has had a very rough month, dropping 35% and undoing the prior period's positive performance. The recent drop completes a disastrous twelve months for shareholders, who are sitting on a 54% loss during that time.
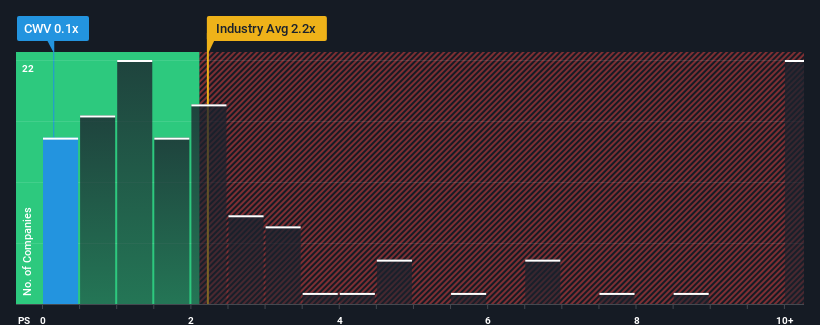
Following the heavy fall in price, Crown Point Energy may be sending very bullish signals at the moment with its price-to-sales (or "P/S") ratio of 0.1x, since almost half of all companies in the Oil and Gas industry in Canada have P/S ratios greater than 2.2x and even P/S higher than 7x are not unusual. Although, it's not wise to just take the P/S at face value as there may be an explanation why it's so limited.
Check out our latest analysis for Crown Point Energy
What Does Crown Point Energy's P/S Mean For Shareholders?
For example, consider that Crown Point Energy's financial performance has been poor lately as its revenue has been in decline. Perhaps the market believes the recent revenue performance isn't good enough to keep up the industry, causing the P/S ratio to suffer. If you like the company, you'd be hoping this isn't the case so that you could potentially pick up some stock while it's out of favour.
Although there are no analyst estimates available for Crown Point Energy, take a look at this free data-rich visualisation to see how the company stacks up on earnings, revenue and cash flow.Do Revenue Forecasts Match The Low P/S Ratio?
Crown Point Energy's P/S ratio would be typical for a company that's expected to deliver very poor growth or even falling revenue, and importantly, perform much worse than the industry.
Retrospectively, the last year delivered a frustrating 24% decrease to the company's top line. Still, the latest three year period has seen an excellent 131% overall rise in revenue, in spite of its unsatisfying short-term performance. Accordingly, while they would have preferred to keep the run going, shareholders would definitely welcome the medium-term rates of revenue growth.
Comparing that recent medium-term revenue trajectory with the industry's one-year growth forecast of 11% shows it's noticeably more attractive.
With this in mind, we find it intriguing that Crown Point Energy's P/S isn't as high compared to that of its industry peers. Apparently some shareholders believe the recent performance has exceeded its limits and have been accepting significantly lower selling prices.
The Key Takeaway
Having almost fallen off a cliff, Crown Point Energy's share price has pulled its P/S way down as well. Typically, we'd caution against reading too much into price-to-sales ratios when settling on investment decisions, though it can reveal plenty about what other market participants think about the company.
Our examination of Crown Point Energy revealed its three-year revenue trends aren't boosting its P/S anywhere near as much as we would have predicted, given they look better than current industry expectations. Potential investors that are sceptical over continued revenue performance may be preventing the P/S ratio from matching previous strong performance. While recent revenue trends over the past medium-term suggest that the risk of a price decline is low, investors appear to perceive a likelihood of revenue fluctuations in the future.
Plus, you should also learn about these 4 warning signs we've spotted with Crown Point Energy.
If these risks are making you reconsider your opinion on Crown Point Energy, explore our interactive list of high quality stocks to get an idea of what else is out there.
New: AI Stock Screener & Alerts
Our new AI Stock Screener scans the market every day to uncover opportunities.
• Dividend Powerhouses (3%+ Yield)
• Undervalued Small Caps with Insider Buying
• High growth Tech and AI Companies
Or build your own from over 50 metrics.
Have feedback on this article? Concerned about the content? Get in touch with us directly. Alternatively, email editorial-team (at) simplywallst.com.
This article by Simply Wall St is general in nature. We provide commentary based on historical data and analyst forecasts only using an unbiased methodology and our articles are not intended to be financial advice. It does not constitute a recommendation to buy or sell any stock, and does not take account of your objectives, or your financial situation. We aim to bring you long-term focused analysis driven by fundamental data. Note that our analysis may not factor in the latest price-sensitive company announcements or qualitative material. Simply Wall St has no position in any stocks mentioned.
Have feedback on this article? Concerned about the content? Get in touch with us directly. Alternatively, email editorial-team@simplywallst.com
About TSXV:CWV
Crown Point Energy
A junior international oil and gas company, explores for, develops, and produces petroleum and natural gas properties.
Slight risk and slightly overvalued.
Similar Companies
Market Insights

Advertisement
Community Narratives
MicroVision will explode future revenue by 380.37% with a vision towards success
Fair Value US$60|98.4% undervalued
TH
Community Contributor
The Indispensable Artery for a New North American Economy
Fair Value CA$132.87|0.7% overvalued
TI
Community Contributor
Recently Updated Narratives
CO

composite32 on Astor Enerji ·
Astor Enerji will surge with a fair value of $140.43 in the next 3 years
Fair Value:₺140.4335.5% undervalued
1 followerusers have followed this narrative
0 commentsusers have commented on this narrative
0 likesusers have liked this narrative
RE

RecMag on Proximus ·
Proximus: The State-Backed Backup Plan with 7% Gross Yield and 15% Currency Upside.
Fair Value:€17.1356.7% undervalued
30 followersusers have followed this narrative
0 commentsusers have commented on this narrative
0 likesusers have liked this narrative
AG


Agricola on IMPACT Silver ·
A case for for IMPACT Silver Corp (TSXV:IPT) to reach USD $4.52 (CAD $6.16) in 2026 (23 bagger in 1 year) and USD $5.76 (CAD $7.89) by 2030
Fair Value:CA$7.8996.2% undervalued
1 followerusers have followed this narrative
0 commentsusers have commented on this narrative
0 likesusers have liked this narrative
Popular Narratives
TH

TheWallstreetKing on MicroVision ·
MicroVision will explode future revenue by 380.37% with a vision towards success
Fair Value:US$6098.4% undervalued
101 followersusers have followed this narrative
10 commentsusers have commented on this narrative
20 likesusers have liked this narrative
OS


oscargarcia on Alphabet ·
The company that turned a verb into a global necessity and basically runs the modern internet, digital ads, smartphones, maps, and AI.
Fair Value:US$3405.8% undervalued
137 followersusers have followed this narrative
6 commentsusers have commented on this narrative
18 likesusers have liked this narrative
AN


AnalystConsensusTarget on NVIDIA ·
NVDA: Expanding AI Demand Will Drive Major Data Center Investments Through 2026
Fair Value:US$250.3929.3% undervalued
929 followersusers have followed this narrative
6 commentsusers have commented on this narrative
23 likesusers have liked this narrative