
Advertisement
Legendary fund manager Li Lu (who Charlie Munger backed) once said, 'The biggest investment risk is not the volatility of prices, but whether you will suffer a permanent loss of capital.' When we think about how risky a company is, we always like to look at its use of debt, since debt overload can lead to ruin. Importantly, Vermilion Energy Inc. (TSE:VET) does carry debt. But the real question is whether this debt is making the company risky.
Why Does Debt Bring Risk?
Generally speaking, debt only becomes a real problem when a company can't easily pay it off, either by raising capital or with its own cash flow. If things get really bad, the lenders can take control of the business. However, a more common (but still painful) scenario is that it has to raise new equity capital at a low price, thus permanently diluting shareholders. By replacing dilution, though, debt can be an extremely good tool for businesses that need capital to invest in growth at high rates of return. The first step when considering a company's debt levels is to consider its cash and debt together.
Check out our latest analysis for Vermilion Energy
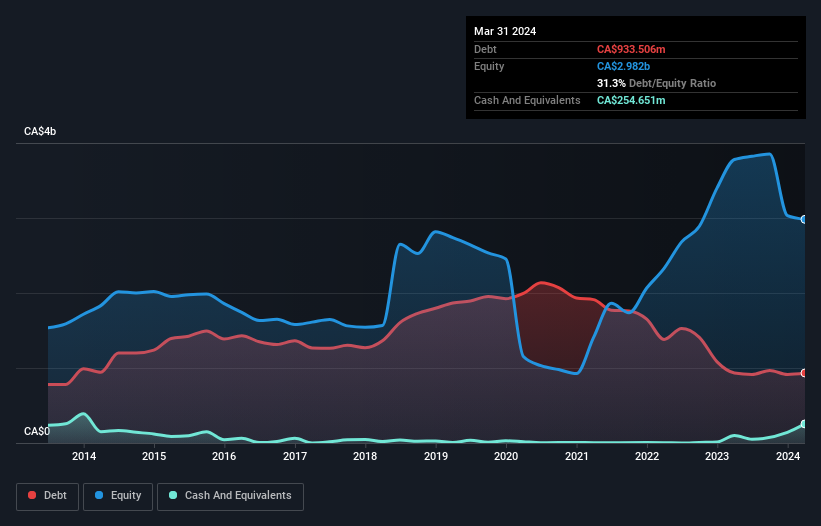
How Much Debt Does Vermilion Energy Carry?
As you can see below, Vermilion Energy had CA$933.5m of debt, at March 2024, which is about the same as the year before. You can click the chart for greater detail. However, it also had CA$254.7m in cash, and so its net debt is CA$678.9m.
How Strong Is Vermilion Energy's Balance Sheet?
We can see from the most recent balance sheet that Vermilion Energy had liabilities of CA$767.2m falling due within a year, and liabilities of CA$2.58b due beyond that. Offsetting this, it had CA$254.7m in cash and CA$365.2m in receivables that were due within 12 months. So its liabilities total CA$2.72b more than the combination of its cash and short-term receivables.
When you consider that this deficiency exceeds the company's CA$2.67b market capitalization, you might well be inclined to review the balance sheet intently. In the scenario where the company had to clean up its balance sheet quickly, it seems likely shareholders would suffer extensive dilution. When analysing debt levels, the balance sheet is the obvious place to start. But ultimately the future profitability of the business will decide if Vermilion Energy can strengthen its balance sheet over time. So if you want to see what the professionals think, you might find this free report on analyst profit forecasts to be interesting.
Over 12 months, Vermilion Energy made a loss at the EBIT level, and saw its revenue drop to CA$1.8b, which is a fall of 38%. To be frank that doesn't bode well.
Caveat Emptor
Not only did Vermilion Energy's revenue slip over the last twelve months, but it also produced negative earnings before interest and tax (EBIT). Its EBIT loss was a whopping CA$415m. Considering that alongside the liabilities mentioned above make us nervous about the company. It would need to improve its operations quickly for us to be interested in it. It's fair to say the loss of CA$616m didn't encourage us either; we'd like to see a profit. And until that time we think this is a risky stock. There's no doubt that we learn most about debt from the balance sheet. However, not all investment risk resides within the balance sheet - far from it. Be aware that Vermilion Energy is showing 2 warning signs in our investment analysis , you should know about...
Of course, if you're the type of investor who prefers buying stocks without the burden of debt, then don't hesitate to discover our exclusive list of net cash growth stocks, today.
New: Manage All Your Stock Portfolios in One Place
We've created the ultimate portfolio companion for stock investors, and it's free.
• Connect an unlimited number of Portfolios and see your total in one currency
• Be alerted to new Warning Signs or Risks via email or mobile
• Track the Fair Value of your stocks
Have feedback on this article? Concerned about the content? Get in touch with us directly. Alternatively, email editorial-team (at) simplywallst.com.
This article by Simply Wall St is general in nature. We provide commentary based on historical data and analyst forecasts only using an unbiased methodology and our articles are not intended to be financial advice. It does not constitute a recommendation to buy or sell any stock, and does not take account of your objectives, or your financial situation. We aim to bring you long-term focused analysis driven by fundamental data. Note that our analysis may not factor in the latest price-sensitive company announcements or qualitative material. Simply Wall St has no position in any stocks mentioned.
About TSX:VET
Vermilion Energy
An oil and gas producer, focuses on the acquisition, exploration, development, and optimization of producing properties in North America, Europe, and Australia.
Slight risk and fair value.
Similar Companies
Market Insights

Advertisement
Community Narratives
MINISO's fair value is projected at 26.69 with an anticipated PE ratio shift of 20x
Fair Value US$24.03|11.0% undervalued
BE
Community Contributor
Procter & Gamble: A Dividend Giant Facing Slowing Growth
Fair Value US$119.81|23.3% overvalued
AN
Community Contributor
Eli Lilly's Future Growth Driven by Tirzepatide and Favorable Market Conditions
Fair Value US$1.19k|13.8% undervalued
EA
Community Contributor