
Advertisement
- Canada
- /
- Oil and Gas
- /
- TSX:TXP
Touchstone Exploration Inc. (TSE:TXP) Might Not Be As Mispriced As It Looks After Plunging 40%
Unfortunately for some shareholders, the Touchstone Exploration Inc. (TSE:TXP) share price has dived 40% in the last thirty days, prolonging recent pain. The recent drop completes a disastrous twelve months for shareholders, who are sitting on a 75% loss during that time.
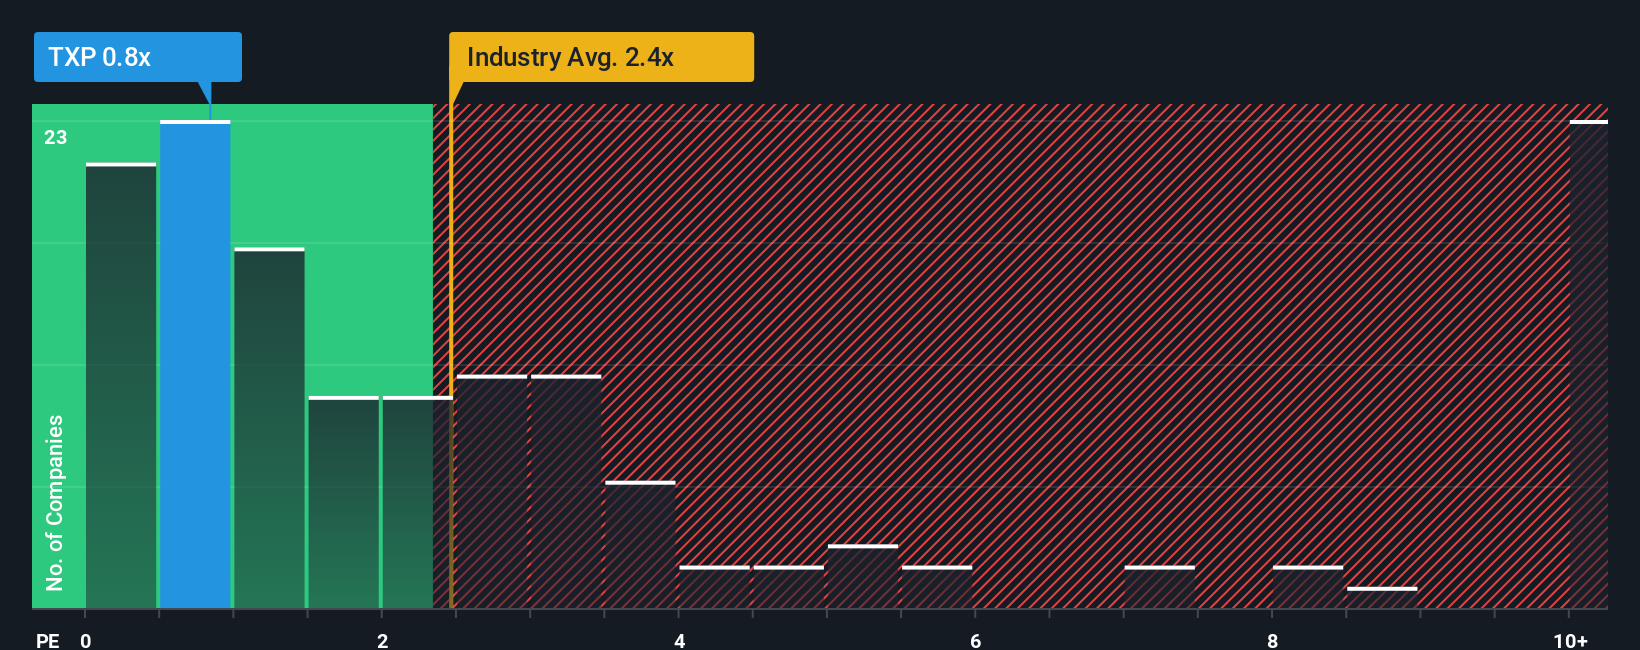
Even after such a large drop in price, Touchstone Exploration may still be sending bullish signals at the moment with its price-to-sales (or "P/S") ratio of 0.8x, since almost half of all companies in the Oil and Gas industry in Canada have P/S ratios greater than 2.4x and even P/S higher than 6x are not unusual. However, the P/S might be low for a reason and it requires further investigation to determine if it's justified.
See our latest analysis for Touchstone Exploration
What Does Touchstone Exploration's P/S Mean For Shareholders?
While the industry has experienced revenue growth lately, Touchstone Exploration's revenue has gone into reverse gear, which is not great. The P/S ratio is probably low because investors think this poor revenue performance isn't going to get any better. So while you could say the stock is cheap, investors will be looking for improvement before they see it as good value.
Want the full picture on analyst estimates for the company? Then our free report on Touchstone Exploration will help you uncover what's on the horizon.What Are Revenue Growth Metrics Telling Us About The Low P/S?
In order to justify its P/S ratio, Touchstone Exploration would need to produce sluggish growth that's trailing the industry.
Retrospectively, the last year delivered a frustrating 24% decrease to the company's top line. Still, the latest three year period has seen an excellent 43% overall rise in revenue, in spite of its unsatisfying short-term performance. Although it's been a bumpy ride, it's still fair to say the revenue growth recently has been more than adequate for the company.
Turning to the outlook, the next year should generate growth of 73% as estimated by the three analysts watching the company. With the industry only predicted to deliver 5.1%, the company is positioned for a stronger revenue result.
With this information, we find it odd that Touchstone Exploration is trading at a P/S lower than the industry. Apparently some shareholders are doubtful of the forecasts and have been accepting significantly lower selling prices.
The Final Word
The southerly movements of Touchstone Exploration's shares means its P/S is now sitting at a pretty low level. Generally, our preference is to limit the use of the price-to-sales ratio to establishing what the market thinks about the overall health of a company.
A look at Touchstone Exploration's revenues reveals that, despite glowing future growth forecasts, its P/S is much lower than we'd expect. When we see strong growth forecasts like this, we can only assume potential risks are what might be placing significant pressure on the P/S ratio. It appears the market could be anticipating revenue instability, because these conditions should normally provide a boost to the share price.
You should always think about risks. Case in point, we've spotted 3 warning signs for Touchstone Exploration you should be aware of, and 2 of them are concerning.
If strong companies turning a profit tickle your fancy, then you'll want to check out this free list of interesting companies that trade on a low P/E (but have proven they can grow earnings).
Valuation is complex, but we're here to simplify it.
Discover if Touchstone Exploration might be undervalued or overvalued with our detailed analysis, featuring fair value estimates, potential risks, dividends, insider trades, and its financial condition.
Access Free AnalysisHave feedback on this article? Concerned about the content? Get in touch with us directly. Alternatively, email editorial-team (at) simplywallst.com.
This article by Simply Wall St is general in nature. We provide commentary based on historical data and analyst forecasts only using an unbiased methodology and our articles are not intended to be financial advice. It does not constitute a recommendation to buy or sell any stock, and does not take account of your objectives, or your financial situation. We aim to bring you long-term focused analysis driven by fundamental data. Note that our analysis may not factor in the latest price-sensitive company announcements or qualitative material. Simply Wall St has no position in any stocks mentioned.
About TSX:TXP
Touchstone Exploration
Engages in the exploration, development, acquisition, production, and sale of petroleum and natural gas properties in the Republic of Trinidad and Tobago.
High growth potential and fair value.
Market Insights

Advertisement
Community Narratives
MINISO's fair value is projected at 26.69 with an anticipated PE ratio shift of 20x
Fair Value US$24.03|11.4% undervalued
BE
Community Contributor
Procter & Gamble: A Dividend Giant Facing Slowing Growth
Fair Value US$119.81|23.5% overvalued
AN
Community Contributor
Eli Lilly's Future Growth Driven by Tirzepatide and Favorable Market Conditions
Fair Value US$1.19k|14.0% undervalued
EA
Community Contributor