Advertisement
- Canada
- /
- Oil and Gas
- /
- TSX:TRP
What Recent Pipeline Progress Means for TC Energy’s Share Price in 2025

Simply Wall St
Reviewed by Bailey Pemberton
- Wondering if TC Energy is trading at a bargain or if you might be overpaying? You are not alone, as valuation is top of mind for many investors lately.
- The stock has been on the move, gaining 2.5% over the past week and rising 12.3% year to date, with a one-year return of 15.1% that may catch the eye of both new and long-term shareholders.
- Recent headlines have highlighted the company's continued progress on major pipeline projects and ongoing strategic asset sales, fueling investor optimism. Regulatory approvals and increasing demand for energy infrastructure have also contributed to positive market sentiment.
- On our quick valuation check, TC Energy scores just 1 out of 6, indicating it looks undervalued in only one area. Let’s break down what that means in practice, explore different ways to judge the company's fair value, and finish with a fresh perspective that could be even more useful for your investment decisions.
TC Energy scores just 1/6 on our valuation checks. See what other red flags we found in the full valuation breakdown.
Approach 1: TC Energy Discounted Cash Flow (DCF) Analysis
The Discounted Cash Flow (DCF) model estimates a company's fair value by projecting its future cash flows and discounting them back to today's value. This approach provides a way to determine what TC Energy's shares might actually be worth based on how much cash the business is expected to generate in the years ahead.
Currently, TC Energy's last twelve months of Free Cash Flow is CA$401.75 million. Looking ahead, analyst estimates project the company will generate CA$2.18 billion in Free Cash Flow by 2026. Further out, Simply Wall St extrapolates an estimated CA$2.2 billion by 2035. These projections take into account both near-term analyst estimates and longer-term growth patterns, always stated in CA$.
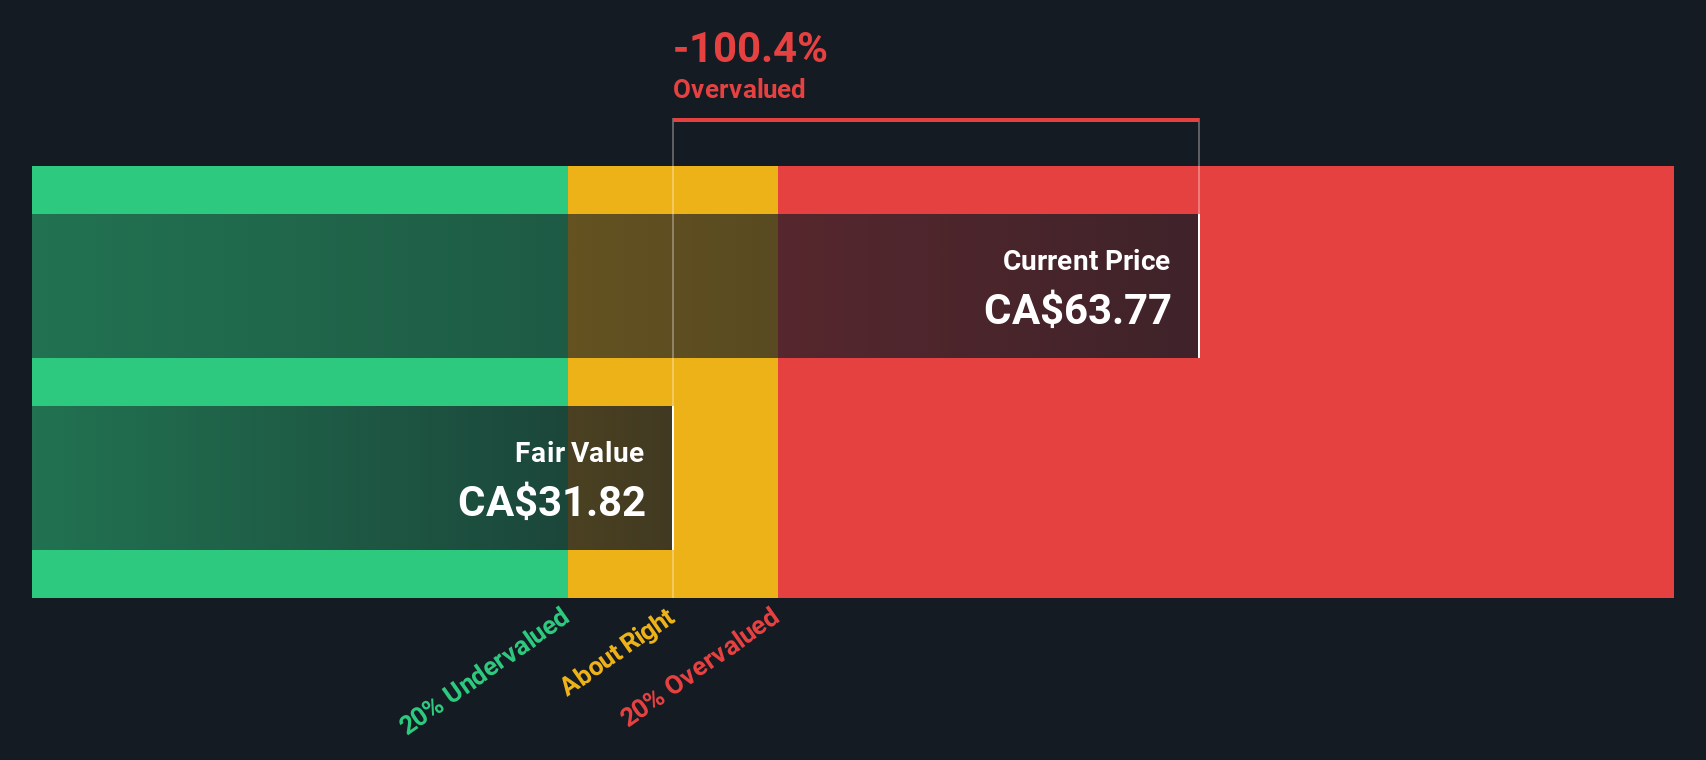
After crunching the numbers using the 2 Stage Free Cash Flow to Equity model, the intrinsic value per share is estimated at CA$45.50. When compared to the current share price, this implies the stock is trading roughly 68.4% above its fair value based on future cash flows. In plain terms, the model suggests TC Energy is significantly overvalued at current market prices.
Result: OVERVALUED
Our Discounted Cash Flow (DCF) analysis suggests TC Energy may be overvalued by 68.4%. Discover 894 undervalued stocks or create your own screener to find better value opportunities.
Approach 2: TC Energy Price vs Earnings (PE Ratio)
The Price-to-Earnings (PE) ratio is a widely used valuation metric for profitable companies because it directly compares a company's share price with its earnings per share. This gives investors a quick sense of how much they are paying for every dollar of profits. For companies like TC Energy that generate consistent earnings, the PE ratio provides useful context for assessing whether the current market price reflects reasonable growth and profitability expectations.
It is important to remember that what counts as a “normal” or “fair” PE ratio depends on several factors, especially future growth prospects and perceived risk. Faster-growing or less risky companies typically trade at higher PE ratios, as investors are willing to pay more for projected earnings growth and stability. Conversely, companies facing challenges or higher uncertainty often warrant lower multiples.
Right now, TC Energy trades at a PE ratio of 21.4x. That is almost identical to the average of its peer group, at 21.5x, and noticeably higher than the Oil and Gas industry average of 14.8x. Simply Wall St goes beyond these simple comparisons by providing a proprietary “Fair Ratio” for each company. This metric calculates what a reasonable PE would be given TC Energy’s underlying growth, profit margins, industry dynamics, and risk profile. For TC Energy, the Fair Ratio is 17.2x, which is lower than both the company’s current PE and its peer average.
The Fair Ratio offers a more precise benchmark than blanket industry or peer comparisons because it adjusts for key differences like growth rates, profitability, market capitalization, and specific risks unique to each business. This approach helps investors judge value on a more level playing field.
With TC Energy’s actual PE ratio sitting at 21.4x versus a Fair Ratio of 17.2x, the stock appears to be trading above what would be justified by its fundamentals alone.
Result: OVERVALUED

PE ratios tell one story, but what if the real opportunity lies elsewhere? Discover 1417 companies where insiders are betting big on explosive growth.
Upgrade Your Decision Making: Choose your TC Energy Narrative
Earlier we mentioned that there is an even better way to understand valuation, so let's introduce you to Narratives. A Narrative is simply the story you believe about a company, your perspective on how its future will unfold, brought to life by linking that story to a set of financial estimates, like revenue growth, future earnings, and profit margins, which ultimately shape what you view as the company's fair value.
Unlike static valuation models, Narratives give investors a flexible and intuitive way to make decisions, helping you connect your understanding of TC Energy’s business prospects, risks, and industry trends directly to your investment thesis. Available on Simply Wall St's Community page, Narratives allow you to adjust key numbers based on your expectations, compare your fair value to the current stock price, and decide whether to buy or sell accordingly. All of these tools are in one place and used by millions of investors globally.
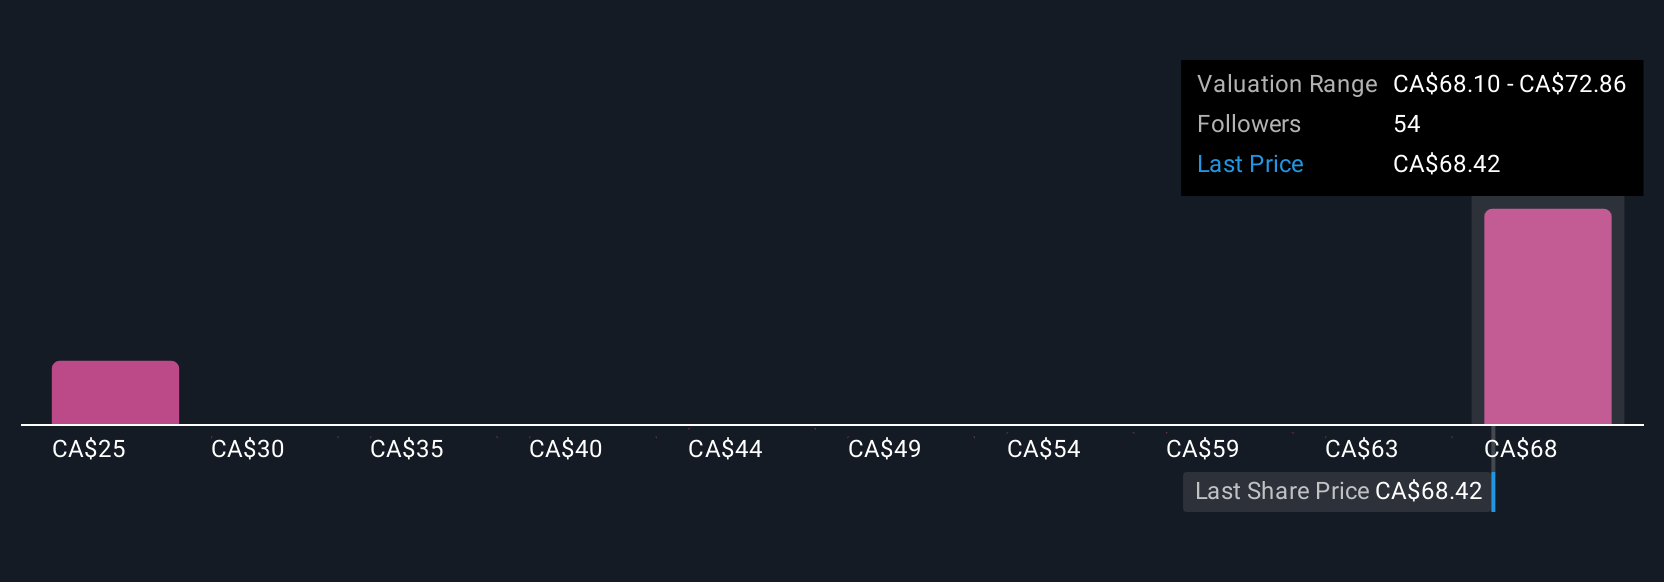
What sets Narratives apart is that they update automatically as new information comes in, such as news events, earnings releases, or changes in the industry outlook, so your view evolves with the market. For example, some TC Energy Narratives project a bullish price target as high as CA$80.00 by 2028 if energy transition risks are manageable and project execution stays on track, while more cautious Narratives see fair value around CA$59.00 should regulatory or demand headwinds persist. This illustrates how your underlying story directly shapes your investment conclusions.
Do you think there's more to the story for TC Energy? Head over to our Community to see what others are saying!
This article by Simply Wall St is general in nature. We provide commentary based on historical data and analyst forecasts only using an unbiased methodology and our articles are not intended to be financial advice. It does not constitute a recommendation to buy or sell any stock, and does not take account of your objectives, or your financial situation. We aim to bring you long-term focused analysis driven by fundamental data. Note that our analysis may not factor in the latest price-sensitive company announcements or qualitative material. Simply Wall St has no position in any stocks mentioned.
Valuation is complex, but we're here to simplify it.
Discover if TC Energy might be undervalued or overvalued with our detailed analysis, featuring fair value estimates, potential risks, dividends, insider trades, and its financial condition.
Access Free AnalysisHave feedback on this article? Concerned about the content? Get in touch with us directly. Alternatively, email editorial-team@simplywallst.com
About TSX:TRP
Limited growth with questionable track record.
Similar Companies
Market Insights

Advertisement
Community Narratives
MicroVision will explode future revenue by 380.37% with a vision towards success
Fair Value US$60.00|98.4% undervalued
TH
Community Contributor
The Indispensable Artery for a New North American Economy
Fair Value CA$132.87|1.3% undervalued
TI
Community Contributor