
Advertisement
Key Insights
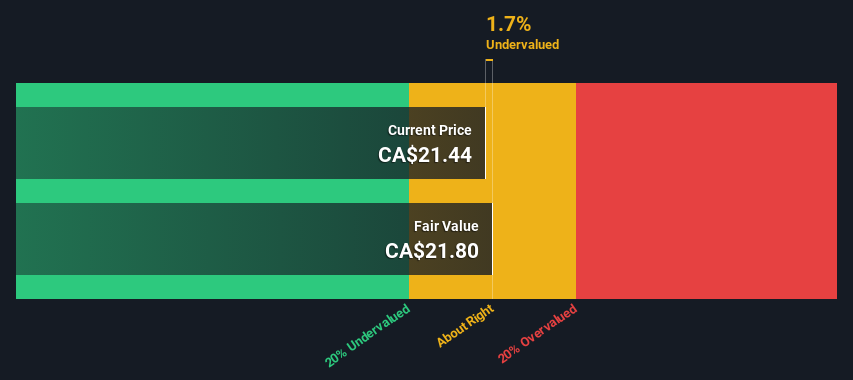
- Topaz Energy's estimated fair value is CA$21.80 based on 2 Stage Free Cash Flow to Equity
- Topaz Energy's CA$21.44 share price indicates it is trading at similar levels as its fair value estimate
- Analyst price target for TPZ is CA$27.45, which is 26% above our fair value estimate
In this article we are going to estimate the intrinsic value of Topaz Energy Corp. (TSE:TPZ) by projecting its future cash flows and then discounting them to today's value. One way to achieve this is by employing the Discounted Cash Flow (DCF) model. Models like these may appear beyond the comprehension of a lay person, but they're fairly easy to follow.
We would caution that there are many ways of valuing a company and, like the DCF, each technique has advantages and disadvantages in certain scenarios. Anyone interested in learning a bit more about intrinsic value should have a read of the Simply Wall St analysis model.
View our latest analysis for Topaz Energy
Is Topaz Energy Fairly Valued?
We use what is known as a 2-stage model, which simply means we have two different periods of growth rates for the company's cash flows. Generally the first stage is higher growth, and the second stage is a lower growth phase. To begin with, we have to get estimates of the next ten years of cash flows. Where possible we use analyst estimates, but when these aren't available we extrapolate the previous free cash flow (FCF) from the last estimate or reported value. We assume companies with shrinking free cash flow will slow their rate of shrinkage, and that companies with growing free cash flow will see their growth rate slow, over this period. We do this to reflect that growth tends to slow more in the early years than it does in later years.
Generally we assume that a dollar today is more valuable than a dollar in the future, so we need to discount the sum of these future cash flows to arrive at a present value estimate:
10-year free cash flow (FCF) estimate
| 2024 | 2025 | 2026 | 2027 | 2028 | 2029 | 2030 | 2031 | 2032 | 2033 | |
| Levered FCF (CA$, Millions) | CA$268.8m | CA$247.0m | CA$244.0m | CA$243.4m | CA$244.3m | CA$246.2m | CA$248.9m | CA$252.2m | CA$255.9m | CA$259.9m |
| Growth Rate Estimate Source | Analyst x5 | Analyst x1 | Analyst x1 | Est @ -0.25% | Est @ 0.37% | Est @ 0.80% | Est @ 1.10% | Est @ 1.31% | Est @ 1.46% | Est @ 1.56% |
| Present Value (CA$, Millions) Discounted @ 9.0% | CA$247 | CA$208 | CA$188 | CA$172 | CA$159 | CA$147 | CA$136 | CA$126 | CA$118 | CA$109 |
("Est" = FCF growth rate estimated by Simply Wall St)
Present Value of 10-year Cash Flow (PVCF) = CA$1.6b
After calculating the present value of future cash flows in the initial 10-year period, we need to calculate the Terminal Value, which accounts for all future cash flows beyond the first stage. The Gordon Growth formula is used to calculate Terminal Value at a future annual growth rate equal to the 5-year average of the 10-year government bond yield of 1.8%. We discount the terminal cash flows to today's value at a cost of equity of 9.0%.
Terminal Value (TV)= FCF2033 × (1 + g) ÷ (r – g) = CA$260m× (1 + 1.8%) ÷ (9.0%– 1.8%) = CA$3.7b
Present Value of Terminal Value (PVTV)= TV / (1 + r)10= CA$3.7b÷ ( 1 + 9.0%)10= CA$1.5b
The total value is the sum of cash flows for the next ten years plus the discounted terminal value, which results in the Total Equity Value, which in this case is CA$3.2b. The last step is to then divide the equity value by the number of shares outstanding. Compared to the current share price of CA$21.4, the company appears about fair value at a 1.7% discount to where the stock price trades currently. The assumptions in any calculation have a big impact on the valuation, so it is better to view this as a rough estimate, not precise down to the last cent.
Important Assumptions
Now the most important inputs to a discounted cash flow are the discount rate, and of course, the actual cash flows. Part of investing is coming up with your own evaluation of a company's future performance, so try the calculation yourself and check your own assumptions. The DCF also does not consider the possible cyclicality of an industry, or a company's future capital requirements, so it does not give a full picture of a company's potential performance. Given that we are looking at Topaz Energy as potential shareholders, the cost of equity is used as the discount rate, rather than the cost of capital (or weighted average cost of capital, WACC) which accounts for debt. In this calculation we've used 9.0%, which is based on a levered beta of 1.217. Beta is a measure of a stock's volatility, compared to the market as a whole. We get our beta from the industry average beta of globally comparable companies, with an imposed limit between 0.8 and 2.0, which is a reasonable range for a stable business.
SWOT Analysis for Topaz Energy
Strength
- Earnings growth over the past year exceeded the industry.
- Debt is not viewed as a risk.
Weakness
- Dividend is low compared to the top 25% of dividend payers in the Oil and Gas market.
Opportunity
- Current share price is below our estimate of fair value.
Threat
- Dividends are not covered by earnings.
- Annual earnings are forecast to decline for the next 2 years.
Next Steps:
Although the valuation of a company is important, it is only one of many factors that you need to assess for a company. The DCF model is not a perfect stock valuation tool. Preferably you'd apply different cases and assumptions and see how they would impact the company's valuation. For example, changes in the company's cost of equity or the risk free rate can significantly impact the valuation. For Topaz Energy, there are three pertinent factors you should assess:
- Risks: You should be aware of the 2 warning signs for Topaz Energy we've uncovered before considering an investment in the company.
- Future Earnings: How does TPZ's growth rate compare to its peers and the wider market? Dig deeper into the analyst consensus number for the upcoming years by interacting with our free analyst growth expectation chart.
- Other High Quality Alternatives: Do you like a good all-rounder? Explore our interactive list of high quality stocks to get an idea of what else is out there you may be missing!
PS. The Simply Wall St app conducts a discounted cash flow valuation for every stock on the TSX every day. If you want to find the calculation for other stocks just search here.
Valuation is complex, but we're here to simplify it.
Discover if Topaz Energy might be undervalued or overvalued with our detailed analysis, featuring fair value estimates, potential risks, dividends, insider trades, and its financial condition.
Access Free AnalysisHave feedback on this article? Concerned about the content? Get in touch with us directly. Alternatively, email editorial-team (at) simplywallst.com.
This article by Simply Wall St is general in nature. We provide commentary based on historical data and analyst forecasts only using an unbiased methodology and our articles are not intended to be financial advice. It does not constitute a recommendation to buy or sell any stock, and does not take account of your objectives, or your financial situation. We aim to bring you long-term focused analysis driven by fundamental data. Note that our analysis may not factor in the latest price-sensitive company announcements or qualitative material. Simply Wall St has no position in any stocks mentioned.
About TSX:TPZ
Topaz Energy
Operates as a royalty and infrastructure energy company in Canada.
Proven track record and fair value.
Market Insights

Advertisement
Community Narratives
The company that turned a verb into a global necessity and basically runs the modern internet, digital ads, smartphones, maps, and AI.
Fair Value US$300.00|6.3% undervalued
OS
Community Contributor
Flowers Foods Pays A Fair Price For Health
Fair Value US$16.12|26.0% undervalued
NV
Community Contributor
TMX Group will thrive with 33.3% profit margin and enduring market moat
Fair Value CA$49.90|3.7% overvalued
LI
Community Contributor