

Key Insights
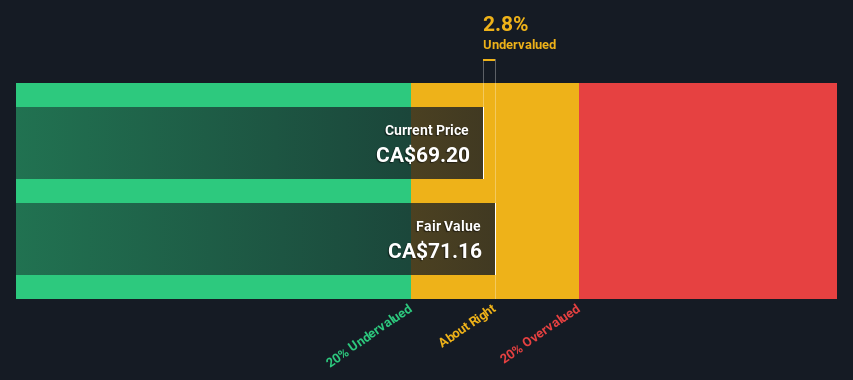
- Tourmaline Oil's estimated fair value is CA$71.16 based on 2 Stage Free Cash Flow to Equity
- Tourmaline Oil's CA$69.20 share price indicates it is trading at similar levels as its fair value estimate
- Our fair value estimate is 11% lower than Tourmaline Oil's analyst price target of CA$80.00
Today we will run through one way of estimating the intrinsic value of Tourmaline Oil Corp. (TSE:TOU) by taking the forecast future cash flows of the company and discounting them back to today's value. The Discounted Cash Flow (DCF) model is the tool we will apply to do this. There's really not all that much to it, even though it might appear quite complex.
Remember though, that there are many ways to estimate a company's value, and a DCF is just one method. If you want to learn more about discounted cash flow, the rationale behind this calculation can be read in detail in the Simply Wall St analysis model.
See our latest analysis for Tourmaline Oil
Crunching The Numbers
We are going to use a two-stage DCF model, which, as the name states, takes into account two stages of growth. The first stage is generally a higher growth period which levels off heading towards the terminal value, captured in the second 'steady growth' period. To start off with, we need to estimate the next ten years of cash flows. Where possible we use analyst estimates, but when these aren't available we extrapolate the previous free cash flow (FCF) from the last estimate or reported value. We assume companies with shrinking free cash flow will slow their rate of shrinkage, and that companies with growing free cash flow will see their growth rate slow, over this period. We do this to reflect that growth tends to slow more in the early years than it does in later years.
A DCF is all about the idea that a dollar in the future is less valuable than a dollar today, and so the sum of these future cash flows is then discounted to today's value:
10-year free cash flow (FCF) estimate
| 2024 | 2025 | 2026 | 2027 | 2028 | 2029 | 2030 | 2031 | 2032 | 2033 | |
| Levered FCF (CA$, Millions) | CA$1.78b | CA$1.77b | CA$1.77b | CA$1.78b | CA$1.79b | CA$1.82b | CA$1.84b | CA$1.87b | CA$1.90b | CA$1.93b |
| Growth Rate Estimate Source | Analyst x6 | Est @ -0.66% | Est @ 0.08% | Est @ 0.59% | Est @ 0.96% | Est @ 1.21% | Est @ 1.39% | Est @ 1.51% | Est @ 1.60% | Est @ 1.66% |
| Present Value (CA$, Millions) Discounted @ 8.7% | CA$1.6k | CA$1.5k | CA$1.4k | CA$1.3k | CA$1.2k | CA$1.1k | CA$1.0k | CA$960 | CA$897 | CA$839 |
("Est" = FCF growth rate estimated by Simply Wall St)
Present Value of 10-year Cash Flow (PVCF) = CA$12b
After calculating the present value of future cash flows in the initial 10-year period, we need to calculate the Terminal Value, which accounts for all future cash flows beyond the first stage. The Gordon Growth formula is used to calculate Terminal Value at a future annual growth rate equal to the 5-year average of the 10-year government bond yield of 1.8%. We discount the terminal cash flows to today's value at a cost of equity of 8.7%.
Terminal Value (TV)= FCF2033 × (1 + g) ÷ (r – g) = CA$1.9b× (1 + 1.8%) ÷ (8.7%– 1.8%) = CA$29b
Present Value of Terminal Value (PVTV)= TV / (1 + r)10= CA$29b÷ ( 1 + 8.7%)10= CA$12b
The total value, or equity value, is then the sum of the present value of the future cash flows, which in this case is CA$24b. To get the intrinsic value per share, we divide this by the total number of shares outstanding. Relative to the current share price of CA$69.2, the company appears about fair value at a 2.8% discount to where the stock price trades currently. The assumptions in any calculation have a big impact on the valuation, so it is better to view this as a rough estimate, not precise down to the last cent.
The Assumptions
Now the most important inputs to a discounted cash flow are the discount rate, and of course, the actual cash flows. You don't have to agree with these inputs, I recommend redoing the calculations yourself and playing with them. The DCF also does not consider the possible cyclicality of an industry, or a company's future capital requirements, so it does not give a full picture of a company's potential performance. Given that we are looking at Tourmaline Oil as potential shareholders, the cost of equity is used as the discount rate, rather than the cost of capital (or weighted average cost of capital, WACC) which accounts for debt. In this calculation we've used 8.7%, which is based on a levered beta of 1.160. Beta is a measure of a stock's volatility, compared to the market as a whole. We get our beta from the industry average beta of globally comparable companies, with an imposed limit between 0.8 and 2.0, which is a reasonable range for a stable business.
SWOT Analysis for Tourmaline Oil
- Debt is not viewed as a risk.
- Dividend is in the top 25% of dividend payers in the market.
- Earnings declined over the past year.
- Annual revenue is forecast to grow faster than the Canadian market.
- Current share price is below our estimate of fair value.
- Dividends are not covered by cash flow.
- Annual earnings are forecast to decline for the next 2 years.
Looking Ahead:
Although the valuation of a company is important, it ideally won't be the sole piece of analysis you scrutinize for a company. It's not possible to obtain a foolproof valuation with a DCF model. Rather it should be seen as a guide to "what assumptions need to be true for this stock to be under/overvalued?" For example, changes in the company's cost of equity or the risk free rate can significantly impact the valuation. For Tourmaline Oil, we've put together three further aspects you should further research:
- Risks: You should be aware of the 2 warning signs for Tourmaline Oil (1 is a bit concerning!) we've uncovered before considering an investment in the company.
- Management:Have insiders been ramping up their shares to take advantage of the market's sentiment for TOU's future outlook? Check out our management and board analysis with insights on CEO compensation and governance factors.
- Other High Quality Alternatives: Do you like a good all-rounder? Explore our interactive list of high quality stocks to get an idea of what else is out there you may be missing!
PS. The Simply Wall St app conducts a discounted cash flow valuation for every stock on the TSX every day. If you want to find the calculation for other stocks just search here.
Valuation is complex, but we're here to simplify it.
Discover if Tourmaline Oil might be undervalued or overvalued with our detailed analysis, featuring fair value estimates, potential risks, dividends, insider trades, and its financial condition.
Access Free AnalysisHave feedback on this article? Concerned about the content? Get in touch with us directly. Alternatively, email editorial-team (at) simplywallst.com.
This article by Simply Wall St is general in nature. We provide commentary based on historical data and analyst forecasts only using an unbiased methodology and our articles are not intended to be financial advice. It does not constitute a recommendation to buy or sell any stock, and does not take account of your objectives, or your financial situation. We aim to bring you long-term focused analysis driven by fundamental data. Note that our analysis may not factor in the latest price-sensitive company announcements or qualitative material. Simply Wall St has no position in any stocks mentioned.
About TSX:TOU
Tourmaline Oil
Explores for and develops oil and natural gas properties in the Western Canadian Sedimentary Basin.
High growth potential with solid track record.

