
Advertisement
- Canada
- /
- Oil and Gas
- /
- TSX:PPR
Revenues Working Against Prairie Provident Resources Inc.'s (TSE:PPR) Share Price Following 29% Dive
Unfortunately for some shareholders, the Prairie Provident Resources Inc. (TSE:PPR) share price has dived 29% in the last thirty days, prolonging recent pain. For any long-term shareholders, the last month ends a year to forget by locking in a 51% share price decline.
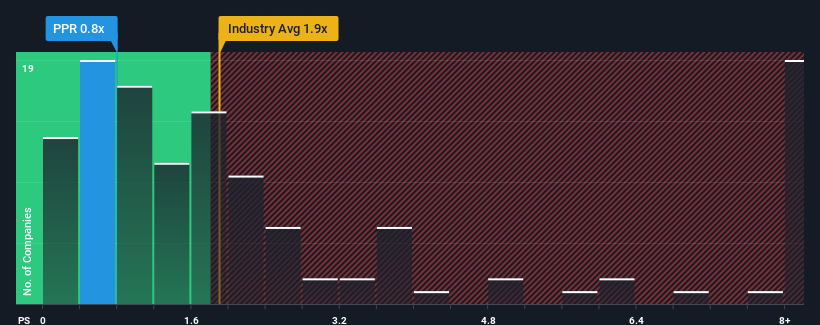
After such a large drop in price, Prairie Provident Resources may be sending bullish signals at the moment with its price-to-sales (or "P/S") ratio of 0.8x, since almost half of all companies in the Oil and Gas industry in Canada have P/S ratios greater than 1.9x and even P/S higher than 6x are not unusual. Nonetheless, we'd need to dig a little deeper to determine if there is a rational basis for the reduced P/S.
See our latest analysis for Prairie Provident Resources
How Prairie Provident Resources Has Been Performing
As an illustration, revenue has deteriorated at Prairie Provident Resources over the last year, which is not ideal at all. Perhaps the market believes the recent revenue performance isn't good enough to keep up the industry, causing the P/S ratio to suffer. Those who are bullish on Prairie Provident Resources will be hoping that this isn't the case so that they can pick up the stock at a lower valuation.
Want the full picture on earnings, revenue and cash flow for the company? Then our free report on Prairie Provident Resources will help you shine a light on its historical performance.What Are Revenue Growth Metrics Telling Us About The Low P/S?
The only time you'd be truly comfortable seeing a P/S as low as Prairie Provident Resources' is when the company's growth is on track to lag the industry.
In reviewing the last year of financials, we were disheartened to see the company's revenues fell to the tune of 37%. Unfortunately, that's brought it right back to where it started three years ago with revenue growth being virtually non-existent overall during that time. Therefore, it's fair to say that revenue growth has been inconsistent recently for the company.
In contrast to the company, the rest of the industry is expected to grow by 12% over the next year, which really puts the company's recent medium-term revenue decline into perspective.
With this in mind, we understand why Prairie Provident Resources' P/S is lower than most of its industry peers. Nonetheless, there's no guarantee the P/S has reached a floor yet with revenue going in reverse. There's potential for the P/S to fall to even lower levels if the company doesn't improve its top-line growth.
The Bottom Line On Prairie Provident Resources' P/S
Prairie Provident Resources' P/S has taken a dip along with its share price. We'd say the price-to-sales ratio's power isn't primarily as a valuation instrument but rather to gauge current investor sentiment and future expectations.
Our examination of Prairie Provident Resources confirms that the company's shrinking revenue over the past medium-term is a key factor in its low price-to-sales ratio, given the industry is projected to grow. At this stage investors feel the potential for an improvement in revenue isn't great enough to justify a higher P/S ratio. Given the current circumstances, it seems unlikely that the share price will experience any significant movement in either direction in the near future if recent medium-term revenue trends persist.
Having said that, be aware Prairie Provident Resources is showing 3 warning signs in our investment analysis, and 2 of those are potentially serious.
If these risks are making you reconsider your opinion on Prairie Provident Resources, explore our interactive list of high quality stocks to get an idea of what else is out there.
New: Manage All Your Stock Portfolios in One Place
We've created the ultimate portfolio companion for stock investors, and it's free.
• Connect an unlimited number of Portfolios and see your total in one currency
• Be alerted to new Warning Signs or Risks via email or mobile
• Track the Fair Value of your stocks
Have feedback on this article? Concerned about the content? Get in touch with us directly. Alternatively, email editorial-team (at) simplywallst.com.
This article by Simply Wall St is general in nature. We provide commentary based on historical data and analyst forecasts only using an unbiased methodology and our articles are not intended to be financial advice. It does not constitute a recommendation to buy or sell any stock, and does not take account of your objectives, or your financial situation. We aim to bring you long-term focused analysis driven by fundamental data. Note that our analysis may not factor in the latest price-sensitive company announcements or qualitative material. Simply Wall St has no position in any stocks mentioned.
About TSX:PPR
Prairie Provident Resources
Engages in the exploration, development, and production of oil and natural gas properties in Alberta.
Moderate risk and slightly overvalued.
Market Insights

Advertisement
Community Narratives
MINISO's fair value is projected at 26.69 with an anticipated PE ratio shift of 20x
Fair Value US$24.03|11.4% undervalued
BE
Community Contributor
Procter & Gamble: A Dividend Giant Facing Slowing Growth
Fair Value US$119.81|23.5% overvalued
AN
Community Contributor
Eli Lilly's Future Growth Driven by Tirzepatide and Favorable Market Conditions
Fair Value US$1.19k|14.0% undervalued
EA
Community Contributor