Advertisement
- Canada
- /
- Oil and Gas
- /
- TSX:POU
Paramount Resources (TSX:POU): Assessing Valuation After Q3 Loss, Raised Guidance, and Dividend Update

Simply Wall St
Reviewed by Simply Wall St
Paramount Resources (TSX:POU) delivered its third quarter update, showing a significant year-over-year dip in quarterly revenue and a shift to a net loss. However, management reaffirmed fourth quarter production targets and raised annual guidance, while declaring a regular dividend.
See our latest analysis for Paramount Resources.
Despite the tough quarterly numbers, Paramount Resources’ share price has shown resilience, posting a 19.2% gain over the past 90 days and recently changing hands at $23.82. While the year-to-date share price return remains down sharply, the long-term story is compelling, with a one-year total shareholder return of 50.8% and a massive 1,494% over five years. This reflects significant value for steadfast investors as momentum builds on recent news.
If Paramount’s rebound got your attention, now’s a good moment to see what else is out there and discover fast growing stocks with high insider ownership
With the share price up from recent lows, investors may wonder if Paramount Resources is now undervalued or if the market has already factored in the company’s improved production outlook and future growth prospects.
Price-to-Earnings of 2.5x: Is it justified?
Paramount Resources’ shares currently trade at a price-to-earnings (P/E) ratio of just 2.5x, which is notably below both peer and industry averages. This suggests the market does not expect robust future earnings.
The price-to-earnings multiple measures how much investors are paying for each dollar of earnings. It serves as a benchmark for value relative to profitability. For energy companies, it is a vital gauge of market confidence in future profit delivery, especially given the sector’s earnings volatility.
Given Paramount’s P/E is far below the Canadian Oil and Gas industry average of 14.3x and the peer average of 39.4x, the market could be discounting weakened earnings forecasts or sector headwinds. Even compared to the estimated fair P/E of 4.3x, the company is priced at a significant discount. This indicates skepticism around sustaining current profit levels.
Explore the SWS fair ratio for Paramount Resources
Result: Price-to-Earnings of 2.5x (UNDERVALUED)
However, falling annual revenue and net income raise concerns about whether Paramount Resources can sustain its recent momentum, given ongoing sector volatility.
Find out about the key risks to this Paramount Resources narrative.
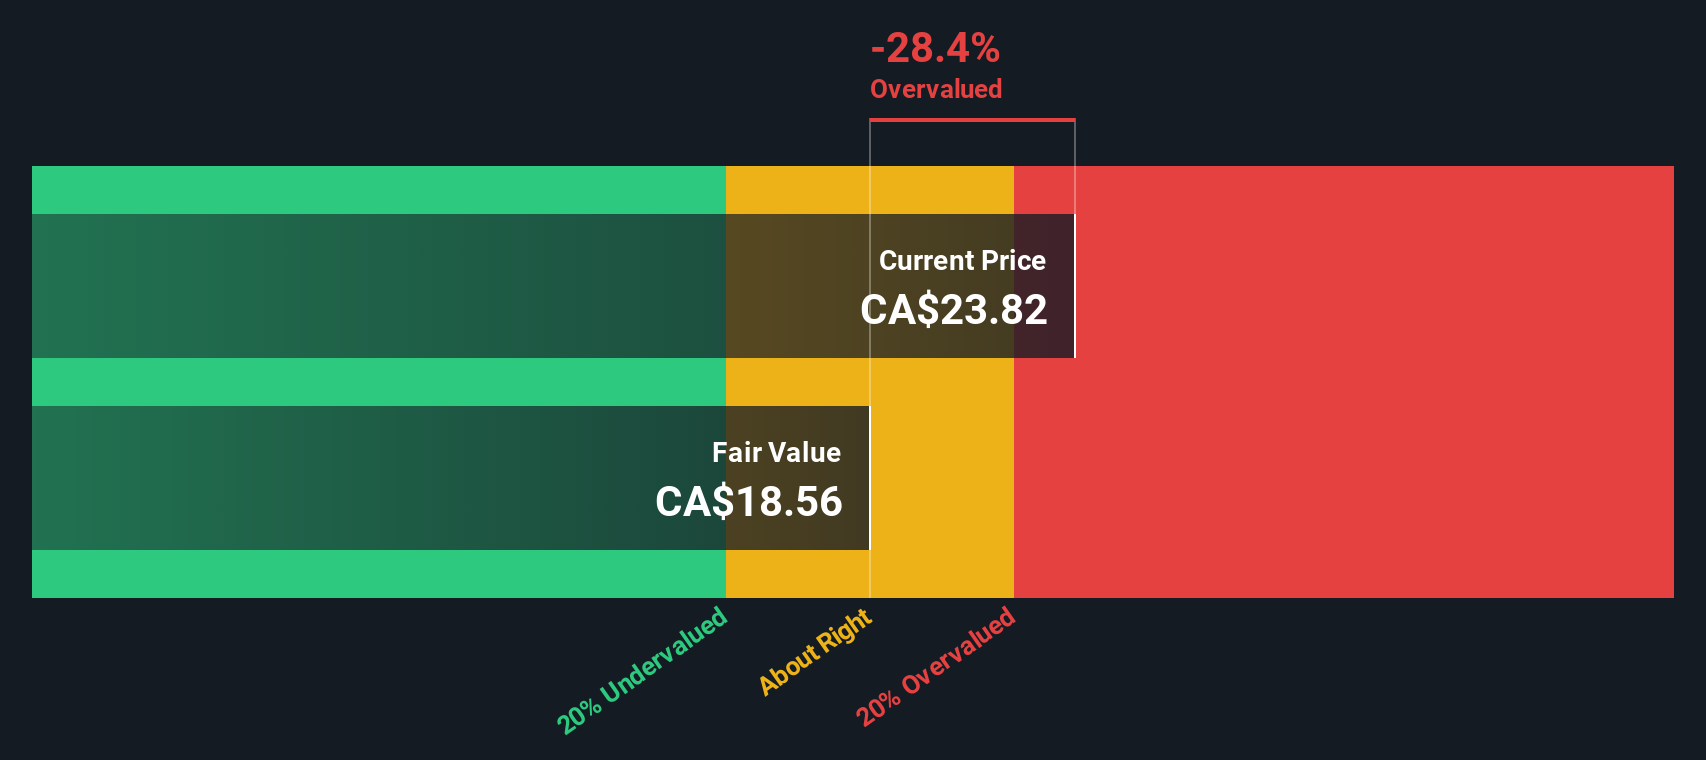
Another View: Our DCF Model Suggests Caution
While the low price-to-earnings ratio points to undervaluation, a look at the SWS DCF model tells a different story. According to our discounted cash flow analysis, Paramount Resources is trading above its estimated fair value. This raises the question: could the market be missing something, or is downside risk being overlooked?
Look into how the SWS DCF model arrives at its fair value.
Simply Wall St performs a discounted cash flow (DCF) on every stock in the world every day (check out Paramount Resources for example). We show the entire calculation in full. You can track the result in your watchlist or portfolio and be alerted when this changes, or use our stock screener to discover 878 undervalued stocks based on their cash flows. If you save a screener we even alert you when new companies match - so you never miss a potential opportunity.
Build Your Own Paramount Resources Narrative
If you’d rather dig deeper or have your own perspective, you can easily dive into the numbers and shape your own outlook in under three minutes. Do it your way
A great starting point for your Paramount Resources research is our analysis highlighting 3 key rewards and 3 important warning signs that could impact your investment decision.
Looking for More Smart Opportunities?
Don’t let great investment ideas pass you by. Confidently pursue new trends and strengthen your portfolio with these hand-picked strategies tailored for forward-thinking investors:
- Capture high yields by checking out these 16 dividend stocks with yields > 3% that offer robust dividends and sustained income potential for your portfolio.
- Tap into the healthcare revolution by uncovering these 31 healthcare AI stocks transforming patient outcomes and harnessing AI-driven breakthroughs in the medical field.
- Ride the next wave in digital innovation by tracking these 82 cryptocurrency and blockchain stocks poised for leadership in blockchain and cryptocurrency advancements.
This article by Simply Wall St is general in nature. We provide commentary based on historical data and analyst forecasts only using an unbiased methodology and our articles are not intended to be financial advice. It does not constitute a recommendation to buy or sell any stock, and does not take account of your objectives, or your financial situation. We aim to bring you long-term focused analysis driven by fundamental data. Note that our analysis may not factor in the latest price-sensitive company announcements or qualitative material. Simply Wall St has no position in any stocks mentioned.
New: Manage All Your Stock Portfolios in One Place
We've created the ultimate portfolio companion for stock investors, and it's free.
• Connect an unlimited number of Portfolios and see your total in one currency
• Be alerted to new Warning Signs or Risks via email or mobile
• Track the Fair Value of your stocks
Have feedback on this article? Concerned about the content? Get in touch with us directly. Alternatively, email editorial-team@simplywallst.com
About TSX:POU
Paramount Resources
An energy company, explores for and develops conventional and unconventional petroleum and natural gas reserves and resources in Canada.
Flawless balance sheet with solid track record.
Similar Companies
Market Insights

Advertisement
Community Narratives
MINISO's fair value is projected at 26.69 with an anticipated PE ratio shift of 20x
Fair Value US$24.03|11.0% undervalued
BE
Community Contributor
Procter & Gamble: A Dividend Giant Facing Slowing Growth
Fair Value US$119.81|23.3% overvalued
AN
Community Contributor
Eli Lilly's Future Growth Driven by Tirzepatide and Favorable Market Conditions
Fair Value US$1.19k|13.8% undervalued
EA
Community Contributor