Boyd Group Services And 2 More TSX Stocks Trading Below Intrinsic Value Estimates

Reviewed by Simply Wall St

With inflation easing and central banks considering rate cuts, the Canadian market is experiencing a period of cautious optimism. In this environment, identifying undervalued stocks can be crucial for investors looking to capitalize on potential opportunities. Boyd Group Services and two other TSX-listed companies are currently trading below their intrinsic value estimates, making them worth a closer look.
Top 10 Undervalued Stocks Based On Cash Flows In Canada
| Name | Current Price | Fair Value (Est) | Discount (Est) |
| goeasy (TSX:GSY) | CA$193.59 | CA$351.64 | 44.9% |
| Amerigo Resources (TSX:ARG) | CA$1.56 | CA$3.08 | 49.4% |
| Kinaxis (TSX:KXS) | CA$146.26 | CA$289.21 | 49.4% |
| Viemed Healthcare (TSX:VMD) | CA$10.45 | CA$20.08 | 48% |
| Constellation Software (TSX:CSU) | CA$4049.73 | CA$7175.71 | 43.6% |
| Boyd Group Services (TSX:BYD) | CA$227.02 | CA$404.85 | 43.9% |
| Energy Fuels (TSX:EFR) | CA$6.83 | CA$13.14 | 48% |
| NanoXplore (TSX:GRA) | CA$2.30 | CA$4.22 | 45.4% |
| TerrAscend (TSX:TSND) | CA$1.79 | CA$3.25 | 44.9% |
| Kits Eyecare (TSX:KITS) | CA$9.73 | CA$19.18 | 49.3% |
Let's dive into some prime choices out of the screener.
Boyd Group Services (TSX:BYD)
Overview: Boyd Group Services Inc., with a market cap of CA$4.87 billion, operates non-franchised collision repair centers across North America.
Operations: The company generates revenue primarily from its Automotive Collision Repair and Related Services segment, which amounted to $3.02 billion.
Estimated Discount To Fair Value: 43.9%
Boyd Group Services appears undervalued based on cash flows, trading at CA$227.02, which is 43.9% below the estimated fair value of CA$404.85. Despite a decline in net income to US$8.38 million for Q1 2024 from US$20.82 million the previous year, earnings are forecasted to grow significantly at 37.6% annually over the next three years, outpacing market expectations of 15.2%. Revenue is also expected to grow faster than the Canadian market at 10.2% per year.
- Our comprehensive growth report raises the possibility that Boyd Group Services is poised for substantial financial growth.
- Click to explore a detailed breakdown of our findings in Boyd Group Services' balance sheet health report.
NanoXplore (TSX:GRA)
Overview: NanoXplore Inc., a graphene company with a market cap of CA$392.40 million, manufactures and supplies graphene powder for industrial markets.
Operations: NanoXplore's revenue segments include the manufacture and supply of graphene powder for industrial markets.
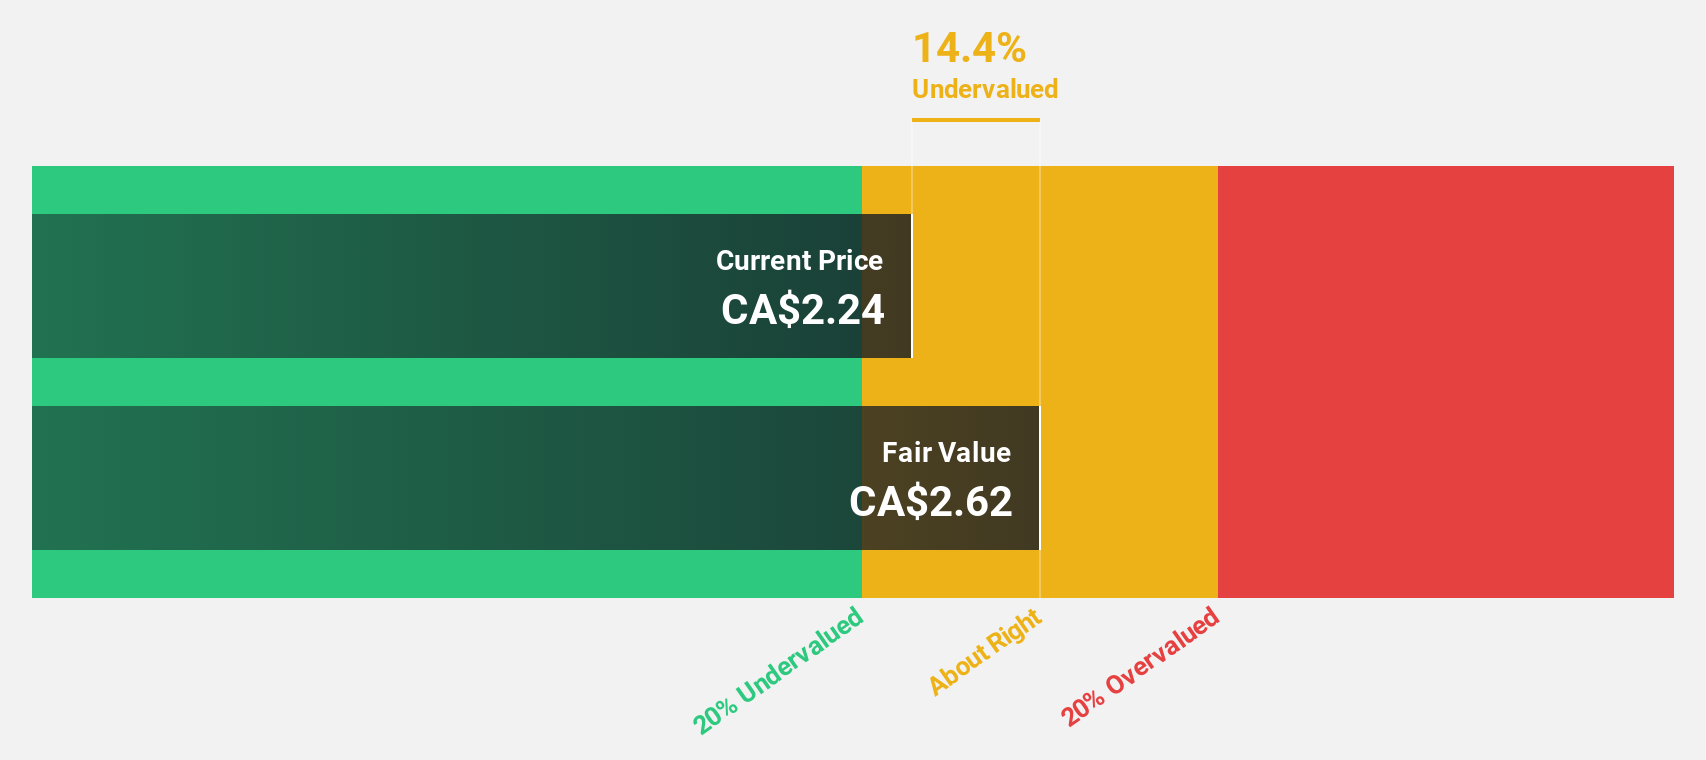
Estimated Discount To Fair Value: 45.4%
NanoXplore is trading at CA$2.30, significantly below its estimated fair value of CA$4.22, indicating it may be undervalued based on cash flows. Recent earnings showed a slight increase in revenue to CA$33.87 million for Q3 2024, though net loss widened to CA$3.09 million. Despite short-term losses, the company is expected to become profitable within three years with annual profit growth above market averages and revenue forecasted to grow at 22.8% per year.
- Upon reviewing our latest growth report, NanoXplore's projected financial performance appears quite optimistic.
- Click here and access our complete balance sheet health report to understand the dynamics of NanoXplore.
Paramount Resources (TSX:POU)
Overview: Paramount Resources Ltd. is a Canadian company that explores and develops conventional and unconventional petroleum and natural gas reserves, with a market cap of CA$3.99 billion.
Operations: Paramount Resources generates revenue primarily through the exploration and development of conventional and unconventional petroleum and natural gas reserves in Canada.
Estimated Discount To Fair Value: 11%
Paramount Resources is trading at CA$27.2, slightly below its estimated fair value of CA$30.58, suggesting it may be undervalued based on cash flows. Recent earnings for Q2 2024 showed revenue of CA$497.9 million and net income of CA$84.5 million, both up from last year. Despite a dividend yield of 6.62% not being well covered by free cash flows, the company has initiated a share repurchase program to enhance shareholder returns.
- The growth report we've compiled suggests that Paramount Resources' future prospects could be on the up.
- Navigate through the intricacies of Paramount Resources with our comprehensive financial health report here.

Key Takeaways
- Click here to access our complete index of 22 Undervalued TSX Stocks Based On Cash Flows.
- Are any of these part of your asset mix? Tap into the analytical power of Simply Wall St's portfolio to get a 360-degree view on how they're shaping up.
- Simply Wall St is a revolutionary app designed for long-term stock investors, it's free and covers every market in the world.
Seeking Other Investments?
- Explore high-performing small cap companies that haven't yet garnered significant analyst attention.
- Diversify your portfolio with solid dividend payers offering reliable income streams to weather potential market turbulence.
- Fuel your portfolio with companies showing strong growth potential, backed by optimistic outlooks both from analysts and management.
This article by Simply Wall St is general in nature. We provide commentary based on historical data and analyst forecasts only using an unbiased methodology and our articles are not intended to be financial advice. It does not constitute a recommendation to buy or sell any stock, and does not take account of your objectives, or your financial situation. We aim to bring you long-term focused analysis driven by fundamental data. Note that our analysis may not factor in the latest price-sensitive company announcements or qualitative material. Simply Wall St has no position in any stocks mentioned.
Valuation is complex, but we're here to simplify it.
Discover if NanoXplore might be undervalued or overvalued with our detailed analysis, featuring fair value estimates, potential risks, dividends, insider trades, and its financial condition.
Access Free AnalysisHave feedback on this article? Concerned about the content? Get in touch with us directly. Alternatively, email editorial-team@simplywallst.com
About TSX:GRA
NanoXplore
A graphene company, manufactures and supplies graphene powder for use in industrial markets.
High growth potential with excellent balance sheet.
