
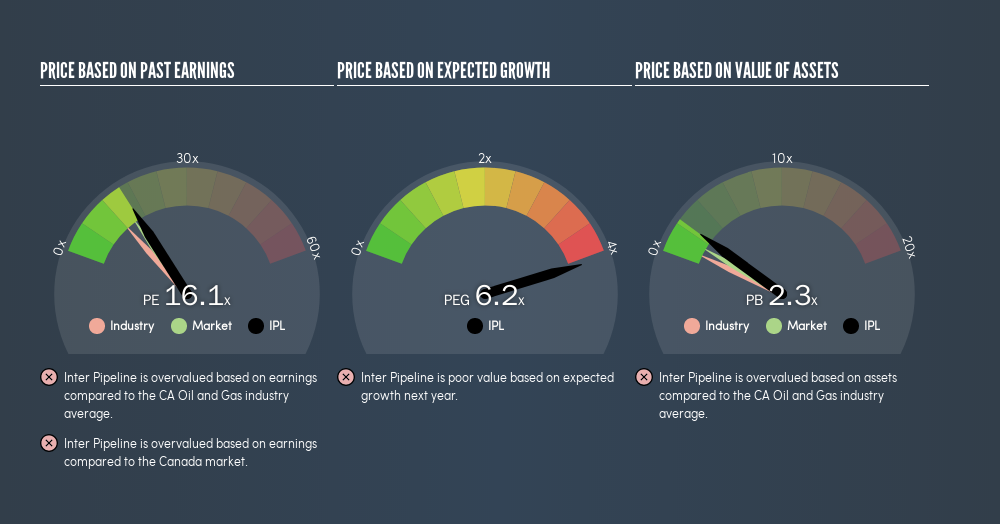
This article is written for those who want to get better at using price to earnings ratios (P/E ratios). We'll apply a basic P/E ratio analysis to Inter Pipeline Ltd.'s (TSE:IPL), to help you decide if the stock is worth further research. Inter Pipeline has a P/E ratio of 16.11, based on the last twelve months. In other words, at today's prices, investors are paying CA$16.11 for every CA$1 in prior year profit.
Check out our latest analysis for Inter Pipeline
How Do I Calculate A Price To Earnings Ratio?
The formula for price to earnings is:
Price to Earnings Ratio = Price per Share ÷ Earnings per Share (EPS)
Or for Inter Pipeline:
P/E of 16.11 = CA$22.39 ÷ CA$1.39 (Based on the trailing twelve months to March 2019.)
Is A High Price-to-Earnings Ratio Good?
A higher P/E ratio implies that investors pay a higher price for the earning power of the business. That isn't a good or a bad thing on its own, but a high P/E means that buyers have a higher opinion of the business's prospects, relative to stocks with a lower P/E.
Does Inter Pipeline Have A Relatively High Or Low P/E For Its Industry?
The P/E ratio essentially measures market expectations of a company. As you can see below, Inter Pipeline has a higher P/E than the average company (12.1) in the oil and gas industry.
Inter Pipeline's P/E tells us that market participants think the company will perform better than its industry peers, going forward.
How Growth Rates Impact P/E Ratios
Generally speaking the rate of earnings growth has a profound impact on a company's P/E multiple. Earnings growth means that in the future the 'E' will be higher. That means unless the share price increases, the P/E will reduce in a few years. So while a stock may look expensive based on past earnings, it could be cheap based on future earnings.
Inter Pipeline shrunk earnings per share by 1.1% last year. But EPS is up 4.5% over the last 3 years.
Don't Forget: The P/E Does Not Account For Debt or Bank Deposits
One drawback of using a P/E ratio is that it considers market capitalization, but not the balance sheet. Thus, the metric does not reflect cash or debt held by the company. Theoretically, a business can improve its earnings (and produce a lower P/E in the future) by investing in growth. That means taking on debt (or spending its cash).
Such spending might be good or bad, overall, but the key point here is that you need to look at debt to understand the P/E ratio in context.
Inter Pipeline's Balance Sheet
Inter Pipeline has net debt worth 63% of its market capitalization. This is a reasonably significant level of debt -- all else being equal you'd expect a much lower P/E than if it had net cash.
The Verdict On Inter Pipeline's P/E Ratio
Inter Pipeline's P/E is 16.1 which is above average (14.7) in its market. With significant debt and no EPS growth last year, shareholders are betting on an improvement in earnings from the company.
Investors should be looking to buy stocks that the market is wrong about. People often underestimate remarkable growth -- so investors can make money when fast growth is not fully appreciated. So this free visualization of the analyst consensus on future earnings could help you make the right decision about whether to buy, sell, or hold.
You might be able to find a better buy than Inter Pipeline. If you want a selection of possible winners, check out this free list of interesting companies that trade on a P/E below 20 (but have proven they can grow earnings).
We aim to bring you long-term focused research analysis driven by fundamental data. Note that our analysis may not factor in the latest price-sensitive company announcements or qualitative material.
If you spot an error that warrants correction, please contact the editor at editorial-team@simplywallst.com. This article by Simply Wall St is general in nature. It does not constitute a recommendation to buy or sell any stock, and does not take account of your objectives, or your financial situation. Simply Wall St has no position in the stocks mentioned. Thank you for reading.
Market Insights

Weekly Picks

Early mover in a fast growing industry. Likely to experience share price volatility as they scale


A case for CA$31.80 (undiluted), aka 8,616% upside from CA$0.37 (an 86 bagger!).


Moderation and Stabilisation: HOLD: Fair Price based on a 4-year Cycle is $12.08
Recently Updated Narratives


Title: Market Sentiment Is Dead Wrong — Here's Why PSEC Deserves a Second Look


An amazing opportunity to potentially get a 100 bagger

Amazon: Why the World’s Biggest Platform Still Runs on Invisible Economics
Popular Narratives


Crazy Undervalued 42 Baggers Silver Play (Active & Running Mine)


NVDA: Expanding AI Demand Will Drive Major Data Center Investments Through 2026


MicroVision will explode future revenue by 380.37% with a vision towards success
Trending Discussion
