Advertisement
- Canada
- /
- Metals and Mining
- /
- TSXV:LEM
3 Promising TSX Penny Stocks To Consider In August 2025

Simply Wall St
Reviewed by Simply Wall St
The Canadian market has shown resilience with improved labour productivity and a healthy rise in hourly compensation, which is helping to support consumer spending and the broader economy. In light of these conditions, investors might find value in exploring opportunities beyond the established giants. Penny stocks, though an older term, continue to hold relevance as they often represent smaller or newer companies with potential for growth; here we examine three such stocks that demonstrate strong financial fundamentals.
Top 10 Penny Stocks In Canada
| Name | Share Price | Market Cap | Rewards & Risks |
| Westbridge Renewable Energy (TSXV:WEB) | CA$0.61 | CA$61.7M | ✅ 3 ⚠️ 3 View Analysis > |
| CEMATRIX (TSX:CEMX) | CA$0.31 | CA$48.06M | ✅ 2 ⚠️ 1 View Analysis > |
| Fintech Select (TSXV:FTEC) | CA$0.04 | CA$2.8M | ✅ 2 ⚠️ 3 View Analysis > |
| Findev (TSXV:FDI) | CA$0.43 | CA$12.75M | ✅ 2 ⚠️ 4 View Analysis > |
| Thor Explorations (TSXV:THX) | CA$0.885 | CA$578.81M | ✅ 3 ⚠️ 2 View Analysis > |
| Automotive Finco (TSXV:AFCC.H) | CA$0.94 | CA$18.63M | ✅ 2 ⚠️ 4 View Analysis > |
| Amerigo Resources (TSX:ARG) | CA$2.08 | CA$335.9M | ✅ 2 ⚠️ 2 View Analysis > |
| Pulse Seismic (TSX:PSD) | CA$3.76 | CA$192.36M | ✅ 2 ⚠️ 1 View Analysis > |
| Hemisphere Energy (TSXV:HME) | CA$1.94 | CA$186.17M | ✅ 3 ⚠️ 1 View Analysis > |
| McChip Resources (TSXV:MCS) | CA$1.47 | CA$8.39M | ✅ 2 ⚠️ 4 View Analysis > |
Click here to see the full list of 430 stocks from our TSX Penny Stocks screener.
Here we highlight a subset of our preferred stocks from the screener.
ACT Energy Technologies (TSX:ACX)
Simply Wall St Financial Health Rating: ★★★★★☆
Overview: ACT Energy Technologies Ltd. offers directional drilling services to oil and natural gas companies in Canada and the United States, with a market capitalization of CA$159.83 million.
Operations: The company generates CA$523.90 million in revenue from its directional drilling services provided to oil and natural gas sectors in Canada and the United States.
Market Cap: CA$159.83M
ACT Energy Technologies Ltd. has shown stable weekly volatility over the past year, with its interest payments well-covered by EBIT at 5 times coverage and a satisfactory net debt to equity ratio of 27.4%. Despite a recent net loss of CA$9.96 million for Q2 2025, the company maintains high-quality earnings and experienced management. Its short-term assets exceed both short-term and long-term liabilities, indicating financial stability. However, earnings growth has decelerated compared to its five-year average, and analysts forecast a slight decline in earnings over the next three years. The company also announced a share repurchase program recently.
- Jump into the full analysis health report here for a deeper understanding of ACT Energy Technologies.
- Explore ACT Energy Technologies' analyst forecasts in our growth report.
Forsys Metals (TSX:FSY)
Simply Wall St Financial Health Rating: ★★★★☆☆
Overview: Forsys Metals Corp. focuses on the acquisition, exploration, and development of uranium mineral properties in Africa and has a market cap of CA$117.98 million.
Operations: Currently, there are no reported revenue segments for the company.
Market Cap: CA$117.98M
Forsys Metals Corp., a pre-revenue company with a market cap of CA$117.98 million, is advancing its Namibplaas uranium property in Namibia through an extensive 64-hole drill program aimed at upgrading resource classification and expanding potential mineralization. Despite being debt-free with short-term assets exceeding liabilities, Forsys faces financial challenges, including less than a year of cash runway and increasing losses over the past five years. Recent earnings reports show consistent net losses, while its share price remains highly volatile. The management team is experienced, providing some stability amid these operational hurdles as they focus on long-term project development.
- Click here to discover the nuances of Forsys Metals with our detailed analytical financial health report.
- Gain insights into Forsys Metals' past trends and performance with our report on the company's historical track record.
Leading Edge Materials (TSXV:LEM)
Simply Wall St Financial Health Rating: ★★★★★☆
Overview: Leading Edge Materials Corp. focuses on the exploration and development of resource properties in Sweden and Romania, with a market cap of CA$35.99 million.
Operations: There are no reported revenue segments for this company.
Market Cap: CA$35.99M
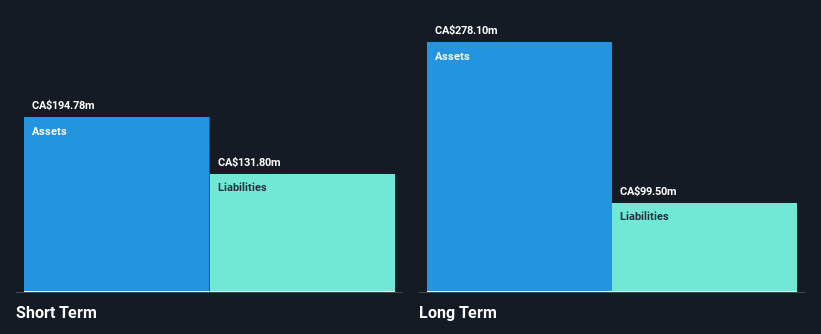
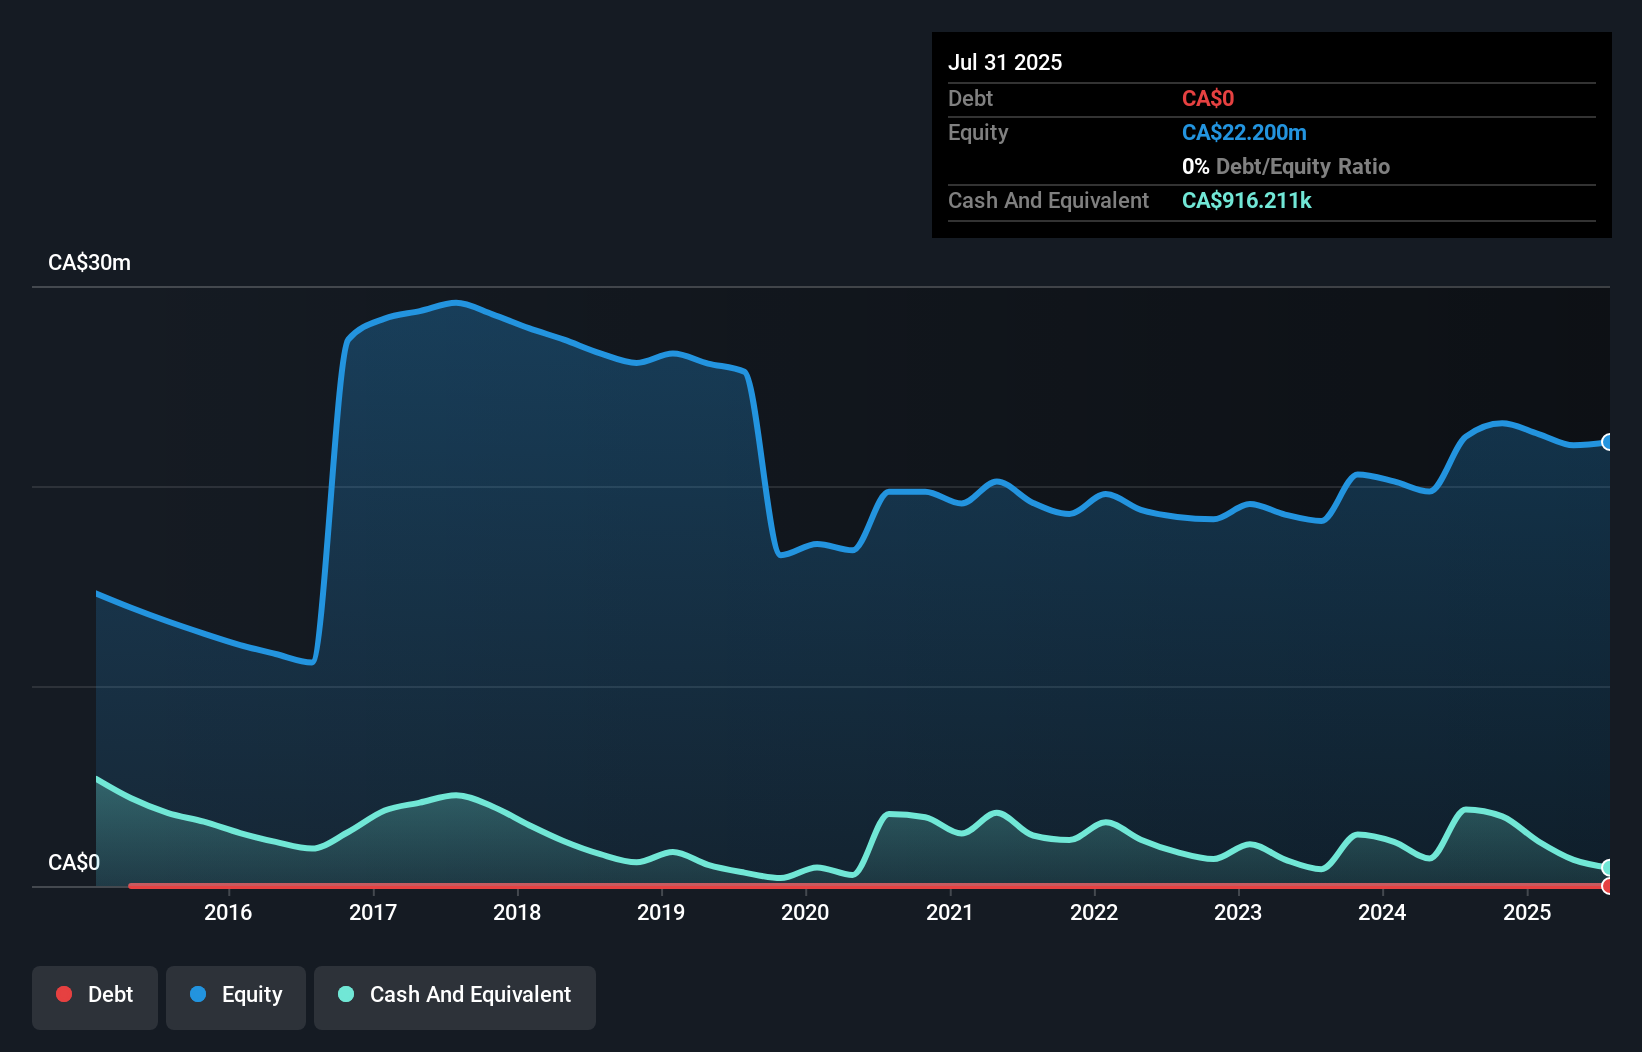
Leading Edge Materials Corp., with a market cap of CA$35.99 million, remains pre-revenue as it explores resource properties in Sweden and Romania. Despite being debt-free, the company’s short-term assets do not cover its long-term liabilities, though they exceed short-term obligations. Recent private placements raised up to CA$4 million to extend its cash runway beyond the current four months. The company's stock has experienced high volatility, with weekly fluctuations still above most Canadian stocks despite some reduction over the past year. Management and board experience lend stability as they navigate financial challenges amid ongoing exploration efforts.
- Click to explore a detailed breakdown of our findings in Leading Edge Materials' financial health report.
- Review our historical performance report to gain insights into Leading Edge Materials' track record.
Taking Advantage
- Discover the full array of 430 TSX Penny Stocks right here.
- Ready To Venture Into Other Investment Styles? AI is about to change healthcare. These 27 stocks are working on everything from early diagnostics to drug discovery. The best part - they are all under $10b in market cap - there's still time to get in early.
This article by Simply Wall St is general in nature. We provide commentary based on historical data and analyst forecasts only using an unbiased methodology and our articles are not intended to be financial advice. It does not constitute a recommendation to buy or sell any stock, and does not take account of your objectives, or your financial situation. We aim to bring you long-term focused analysis driven by fundamental data. Note that our analysis may not factor in the latest price-sensitive company announcements or qualitative material. Simply Wall St has no position in any stocks mentioned.
New: AI Stock Screener & Alerts
Our new AI Stock Screener scans the market every day to uncover opportunities.
• Dividend Powerhouses (3%+ Yield)
• Undervalued Small Caps with Insider Buying
• High growth Tech and AI Companies
Or build your own from over 50 metrics.
Have feedback on this article? Concerned about the content? Get in touch with us directly. Alternatively, email editorial-team@simplywallst.com
About TSXV:LEM
Leading Edge Materials
Engages in the exploration and development of resource properties in Sweden and Romania.
Excellent balance sheet with low risk.
Similar Companies
Market Insights

Advertisement
Community Narratives
The company that turned a verb into a global necessity and basically runs the modern internet, digital ads, smartphones, maps, and AI.
Fair Value US$300.00|5.4% undervalued
OS
Community Contributor
Flowers Foods Pays A Fair Price For Health
Fair Value US$16.12|26.3% undervalued
NV
Community Contributor
TMX Group will thrive with 33.3% profit margin and enduring market moat
Fair Value CA$49.90|4.1% overvalued
LI
Community Contributor
The "Molecular Pencil": Why Beam's Technology is Built to Win
Fair Value US$65.01|62.7% undervalued
DA
Community Contributor