Stock Analysis


There are a few key trends to look for if we want to identify the next multi-bagger. One common approach is to try and find a company with returns on capital employed (ROCE) that are increasing, in conjunction with a growing amount of capital employed. If you see this, it typically means it's a company with a great business model and plenty of profitable reinvestment opportunities. So when we looked at the ROCE trend of Enerplus (TSE:ERF) we really liked what we saw.
Understanding Return On Capital Employed (ROCE)
If you haven't worked with ROCE before, it measures the 'return' (pre-tax profit) a company generates from capital employed in its business. To calculate this metric for Enerplus, this is the formula:
Return on Capital Employed = Earnings Before Interest and Tax (EBIT) ÷ (Total Assets - Current Liabilities)
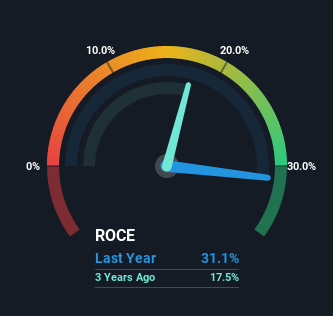
0.31 = US$393m ÷ (US$2.0b - US$773m) (Based on the trailing twelve months to March 2022).
So, Enerplus has an ROCE of 31%. That's a fantastic return and not only that, it outpaces the average of 12% earned by companies in a similar industry.
View our latest analysis for Enerplus
In the above chart we have measured Enerplus' prior ROCE against its prior performance, but the future is arguably more important. If you'd like, you can check out the forecasts from the analysts covering Enerplus here for free.
What Does the ROCE Trend For Enerplus Tell Us?
You'd find it hard not to be impressed with the ROCE trend at Enerplus. The figures show that over the last five years, returns on capital have grown by 1,115%. That's not bad because this tells for every dollar invested (capital employed), the company is increasing the amount earned from that dollar. Speaking of capital employed, the company is actually utilizing 30% less than it was five years ago, which can be indicative of a business that's improving its efficiency. If this trend continues, the business might be getting more efficient but it's shrinking in terms of total assets.
For the record though, there was a noticeable increase in the company's current liabilities over the period, so we would attribute some of the ROCE growth to that. Essentially the business now has suppliers or short-term creditors funding about 38% of its operations, which isn't ideal. Keep an eye out for future increases because when the ratio of current liabilities to total assets gets particularly high, this can introduce some new risks for the business.
In Conclusion...
From what we've seen above, Enerplus has managed to increase it's returns on capital all the while reducing it's capital base. And investors seem to expect more of this going forward, since the stock has rewarded shareholders with a 66% return over the last five years. Therefore, we think it would be worth your time to check if these trends are going to continue.
One more thing, we've spotted 2 warning signs facing Enerplus that you might find interesting.
Enerplus is not the only stock earning high returns. If you'd like to see more, check out our free list of companies earning high returns on equity with solid fundamentals.
Valuation is complex, but we're here to simplify it.
Discover if Enerplus might be undervalued or overvalued with our detailed analysis, featuring fair value estimates, potential risks, dividends, insider trades, and its financial condition.
Access Free AnalysisHave feedback on this article? Concerned about the content? Get in touch with us directly. Alternatively, email editorial-team (at) simplywallst.com.
This article by Simply Wall St is general in nature. We provide commentary based on historical data and analyst forecasts only using an unbiased methodology and our articles are not intended to be financial advice. It does not constitute a recommendation to buy or sell any stock, and does not take account of your objectives, or your financial situation. We aim to bring you long-term focused analysis driven by fundamental data. Note that our analysis may not factor in the latest price-sensitive company announcements or qualitative material. Simply Wall St has no position in any stocks mentioned.
About TSX:ERF
Enerplus
Explores and develops crude oil and natural gas in the United States.
Undervalued with adequate balance sheet.
