Advertisement
- Canada
- /
- Oil and Gas
- /
- TSX:CCO
Does Cameco’s Recent 8% Slide Signal a Better Entry in 2025?

Simply Wall St
Reviewed by Bailey Pemberton
- Ever wondered if Cameco is actually a bargain or just riding the latest wave? You are not alone in asking the value question about this stock.
- Despite a sharp 8.3% drop in the last week, Cameco stock is still up a massive 82.0% year-to-date and an eye-watering 1,005.2% over five years, turning plenty of heads among growth-focused investors.
- Recently, the stock price surge has been fueled by heightened global interest in nuclear energy and government policy shifts that favor uranium production, both adding to Cameco’s momentum. As discussions on clean energy alternatives heat up, Cameco continues to capture headlines and spark debate regarding its long-term value.
- But here is the twist. On our six-point valuation check, Cameco scores 0/6 for undervaluation. We will dig into how these valuations are reached, and why there might be another, more insightful way to think about Cameco’s value, coming up later in this article.
Cameco scores just 0/6 on our valuation checks. See what other red flags we found in the full valuation breakdown.
Approach 1: Cameco Discounted Cash Flow (DCF) Analysis
A Discounted Cash Flow (DCF) model estimates a company’s value by projecting its future cash flows and then discounting those expected amounts back to their value today. The goal is to determine how much the company’s future profitability is worth in today’s terms.
For Cameco, the DCF uses a 2 Stage Free Cash Flow to Equity method. Cameco’s current last twelve months (LTM) Free Cash Flow sits at CA$910.6 Million. Analysts see this number rising, with projections reaching CA$1.49 Billion by the end of 2029. Beyond five years, Simply Wall St extrapolates these longer-term figures using its models, as analyst estimates typically only cover up to five years.
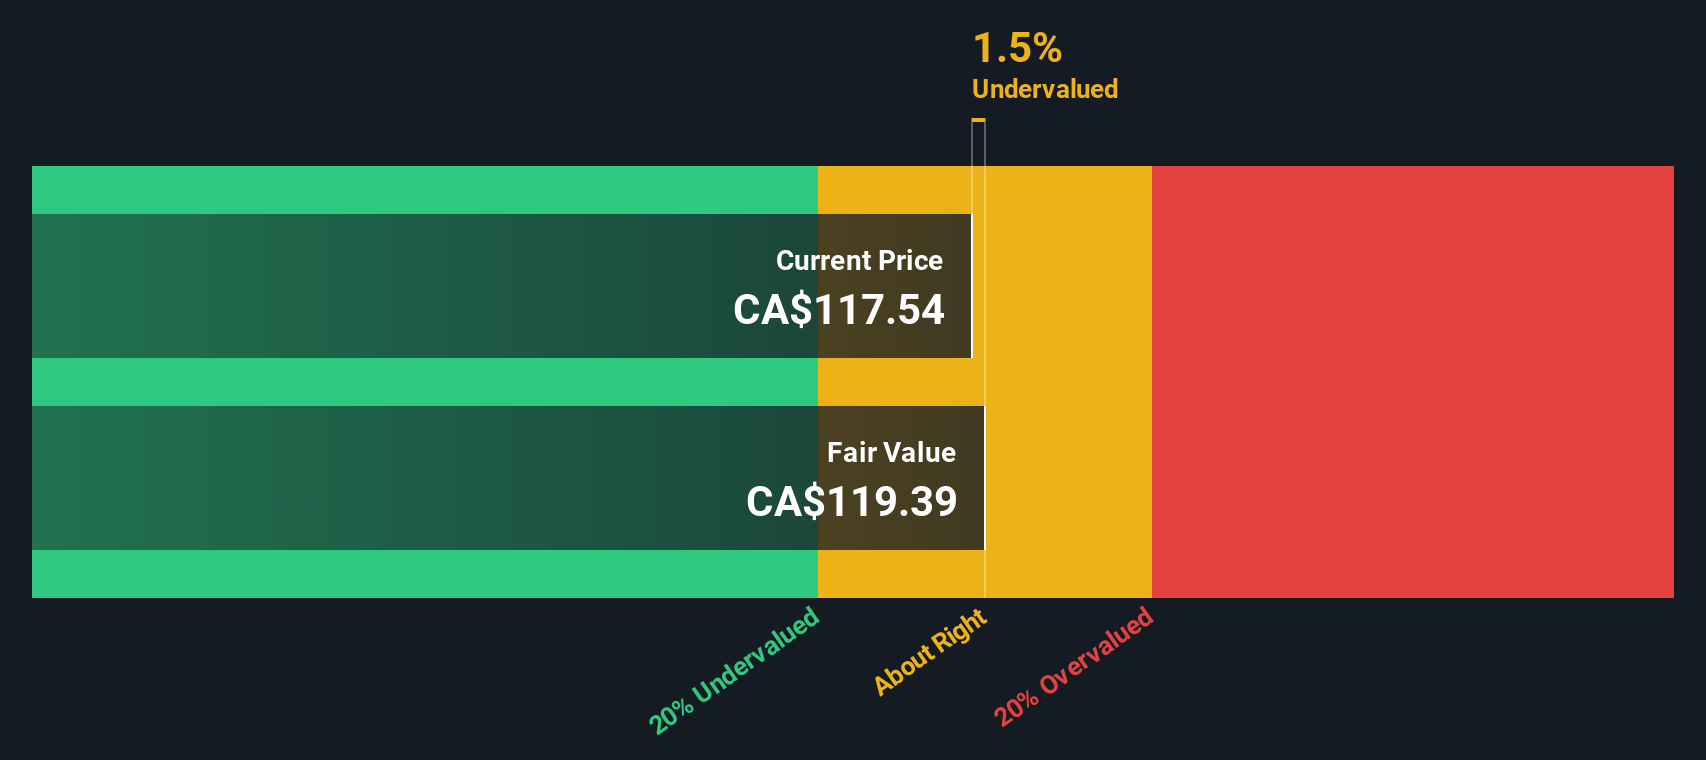
Using these growth assumptions, the DCF model calculates an intrinsic fair value of CA$97.23 per share. However, with the current trading price well above this level, the DCF suggests Cameco stock is roughly 40.6% overvalued by this metric.
Result: OVERVALUED
Our Discounted Cash Flow (DCF) analysis suggests Cameco may be overvalued by 40.6%. Discover 840 undervalued stocks or create your own screener to find better value opportunities.
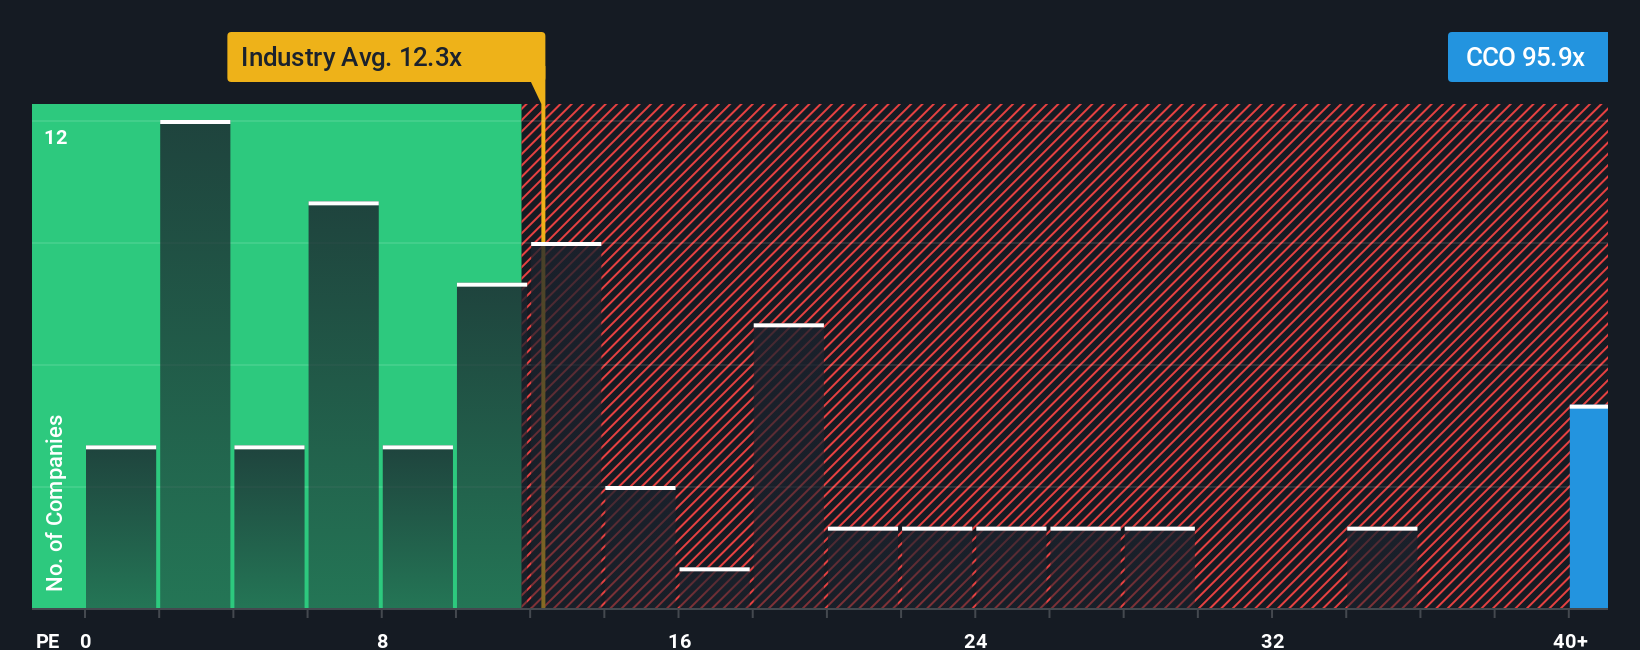
Approach 2: Cameco Price vs Earnings (P/E)
The Price-to-Earnings (P/E) ratio is a widely used valuation metric for profitable companies because it compares a company’s share price to its annual earnings, giving investors a simple way to gauge how much they are paying for each dollar of profit. It is particularly useful for companies like Cameco with a solid history of positive earnings.
In determining what a “normal” or “fair” P/E ratio should look like, it is important to consider a company’s growth expectations and overall risk profile. Generally, companies with above-average growth or lower risk can justify higher P/E ratios, while slower-growth or riskier businesses tend to have lower multiples.
Cameco’s current P/E ratio is a steep 111.52x, vastly higher than both the Oil and Gas industry average of 12.16x and its peer group’s average of 13.92x. At first glance, this could make the stock appear extremely expensive. However, relying solely on these averages can be misleading, as they do not account for Cameco’s specific growth outlook, profit margins, or risk profile.
This is where Simply Wall St’s proprietary “Fair Ratio” comes into play. The Fair Ratio for Cameco is 18.65x. This figure reflects a tailored multiple that factors in its unique fundamentals such as future earnings growth, industry position, profit margins, market capitalisation, and company-specific risks. By using the Fair Ratio, investors get a far more meaningful benchmark than the blunt tool of industry averages or peer multiples.
Comparing Cameco’s actual P/E of 111.52x to its Fair Ratio of 18.65x, the stock stands out as significantly overvalued on this measure.
Result: OVERVALUED
PE ratios tell one story, but what if the real opportunity lies elsewhere? Discover 1410 companies where insiders are betting big on explosive growth.
Upgrade Your Decision Making: Choose your Cameco Narrative
Earlier we mentioned that there is an even better way to understand valuation, so let’s introduce you to Narratives. A Narrative is a simple, accessible way for investors to connect their personal story or viewpoint about a company with the numbers, such as their own fair value estimate and forecasts for its revenue, earnings, and profit margins. Unlike traditional ratios or static analyst estimates, Narratives combine a company’s business story and its financial future in a way that results in a live, custom fair value price.
Available directly in the Community page on Simply Wall St and used by millions, Narratives help users decide when to buy or sell by letting them compare their unique fair value against the current market price. As news or earnings updates are released, Narratives update automatically, ensuring your view always reflects the most current information. For instance, one Cameco investor may believe in accelerating nuclear demand, estimating strong future margins and assigning a fair value of CA$131.00, while another may be more cautious about project delays and margin pressures, believing the shares are only worth CA$100.00. Both perspectives can be expressed, compared, and tracked as Narratives.
Do you think there's more to the story for Cameco? Head over to our Community to see what others are saying!
This article by Simply Wall St is general in nature. We provide commentary based on historical data and analyst forecasts only using an unbiased methodology and our articles are not intended to be financial advice. It does not constitute a recommendation to buy or sell any stock, and does not take account of your objectives, or your financial situation. We aim to bring you long-term focused analysis driven by fundamental data. Note that our analysis may not factor in the latest price-sensitive company announcements or qualitative material. Simply Wall St has no position in any stocks mentioned.
New: AI Stock Screener & Alerts
Our new AI Stock Screener scans the market every day to uncover opportunities.
• Dividend Powerhouses (3%+ Yield)
• Undervalued Small Caps with Insider Buying
• High growth Tech and AI Companies
Or build your own from over 50 metrics.
Have feedback on this article? Concerned about the content? Get in touch with us directly. Alternatively, email editorial-team@simplywallst.com
About TSX:CCO
Solid track record with excellent balance sheet.
Similar Companies
Market Insights

Advertisement
Community Narratives
The company that turned a verb into a global necessity and basically runs the modern internet, digital ads, smartphones, maps, and AI.
Fair Value US$300.00|7.5% undervalued
OS
Community Contributor
Flowers Foods Pays A Fair Price For Health
Fair Value US$16.12|25.4% undervalued
NV
Community Contributor
TMX Group will thrive with 33.3% profit margin and enduring market moat
Fair Value CA$49.90|3.6% overvalued
LI
Community Contributor
The "Molecular Pencil": Why Beam's Technology is Built to Win
Fair Value US$65.01|65.0% undervalued
DA
Community Contributor