
Advertisement
- Canada
- /
- Oil and Gas
- /
- CNSX:TCF
Take Care Before Jumping Onto Trillion Energy International Inc. (CSE:TCF) Even Though It's 28% Cheaper
Trillion Energy International Inc. (CSE:TCF) shares have had a horrible month, losing 28% after a relatively good period beforehand. The recent drop completes a disastrous twelve months for shareholders, who are sitting on a 93% loss during that time.
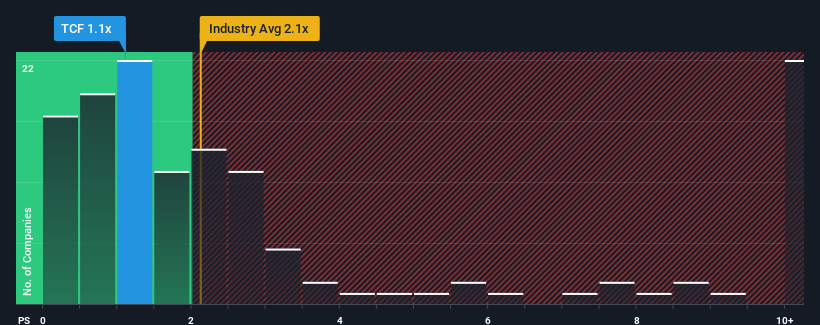
Following the heavy fall in price, Trillion Energy International may be sending buy signals at present with its price-to-sales (or "P/S") ratio of 1.1x, considering almost half of all companies in the Oil and Gas industry in Canada have P/S ratios greater than 2.1x and even P/S higher than 6x aren't out of the ordinary. However, the P/S might be low for a reason and it requires further investigation to determine if it's justified.
Check out our latest analysis for Trillion Energy International
How Has Trillion Energy International Performed Recently?
Recent times haven't been great for Trillion Energy International as its revenue has been falling quicker than most other companies. The P/S ratio is probably low because investors think this poor revenue performance isn't going to improve at all. So while you could say the stock is cheap, investors will be looking for improvement before they see it as good value. Or at the very least, you'd be hoping the revenue slide doesn't get any worse if your plan is to pick up some stock while it's out of favour.
Want the full picture on analyst estimates for the company? Then our free report on Trillion Energy International will help you uncover what's on the horizon.How Is Trillion Energy International's Revenue Growth Trending?
The only time you'd be truly comfortable seeing a P/S as low as Trillion Energy International's is when the company's growth is on track to lag the industry.
In reviewing the last year of financials, we were disheartened to see the company's revenues fell to the tune of 17%. Spectacularly, three year revenue growth has ballooned by several orders of magnitude, despite the drawbacks experienced in the last 12 months. Accordingly, shareholders will be pleased, but also have some serious questions to ponder about the last 12 months.
Looking ahead now, revenue is anticipated to climb by 232% during the coming year according to the one analyst following the company. That's shaping up to be materially higher than the 5.2% growth forecast for the broader industry.
In light of this, it's peculiar that Trillion Energy International's P/S sits below the majority of other companies. It looks like most investors are not convinced at all that the company can achieve future growth expectations.
The Bottom Line On Trillion Energy International's P/S
Trillion Energy International's P/S has taken a dip along with its share price. Using the price-to-sales ratio alone to determine if you should sell your stock isn't sensible, however it can be a practical guide to the company's future prospects.
Trillion Energy International's analyst forecasts revealed that its superior revenue outlook isn't contributing to its P/S anywhere near as much as we would have predicted. When we see strong growth forecasts like this, we can only assume potential risks are what might be placing significant pressure on the P/S ratio. While the possibility of the share price plunging seems unlikely due to the high growth forecasted for the company, the market does appear to have some hesitation.
We don't want to rain on the parade too much, but we did also find 3 warning signs for Trillion Energy International (1 doesn't sit too well with us!) that you need to be mindful of.
If these risks are making you reconsider your opinion on Trillion Energy International, explore our interactive list of high quality stocks to get an idea of what else is out there.
Valuation is complex, but we're here to simplify it.
Discover if Trillion Energy International might be undervalued or overvalued with our detailed analysis, featuring fair value estimates, potential risks, dividends, insider trades, and its financial condition.
Access Free AnalysisHave feedback on this article? Concerned about the content? Get in touch with us directly. Alternatively, email editorial-team (at) simplywallst.com.
This article by Simply Wall St is general in nature. We provide commentary based on historical data and analyst forecasts only using an unbiased methodology and our articles are not intended to be financial advice. It does not constitute a recommendation to buy or sell any stock, and does not take account of your objectives, or your financial situation. We aim to bring you long-term focused analysis driven by fundamental data. Note that our analysis may not factor in the latest price-sensitive company announcements or qualitative material. Simply Wall St has no position in any stocks mentioned.
About CNSX:TCF
Trillion Energy International
Operates an oil and gas exploration and production company primarily in Turkiye.
Moderate risk and slightly overvalued.
Similar Companies
Market Insights

Advertisement
Community Narratives
MicroVision will explode future revenue by 380.37% with a vision towards success
Fair Value US$60|98.4% undervalued
TH
Community Contributor
The Indispensable Artery for a New North American Economy
Fair Value CA$132.87|0.7% overvalued
TI
Community Contributor
Recently Updated Narratives
PO

PortfolioPlus on Bisalloy Steel Group ·
Bisalloy Steel Group will shine with a projected profit margin increase of 12.8%
Fair Value:AU$6.7118.0% undervalued
1 followerusers have followed this narrative
0 commentsusers have commented on this narrative
0 likesusers have liked this narrative
CO

composite32 on Astor Enerji ·
Astor Enerji will surge with a fair value of $140.43 in the next 3 years
Fair Value:₺140.4335.5% undervalued
1 followerusers have followed this narrative
0 commentsusers have commented on this narrative
0 likesusers have liked this narrative
RE

RecMag on Proximus ·
Proximus: The State-Backed Backup Plan with 7% Gross Yield and 15% Currency Upside.
Fair Value:€17.1356.7% undervalued
31 followersusers have followed this narrative
0 commentsusers have commented on this narrative
0 likesusers have liked this narrative
Popular Narratives
TH

TheWallstreetKing on MicroVision ·
MicroVision will explode future revenue by 380.37% with a vision towards success
Fair Value:US$6098.4% undervalued
101 followersusers have followed this narrative
10 commentsusers have commented on this narrative
20 likesusers have liked this narrative
AN


AnalystConsensusTarget on NVIDIA ·
NVDA: Expanding AI Demand Will Drive Major Data Center Investments Through 2026
Fair Value:US$250.3929.3% undervalued
932 followersusers have followed this narrative
6 commentsusers have commented on this narrative
23 likesusers have liked this narrative
OS


oscargarcia on Alphabet ·
The company that turned a verb into a global necessity and basically runs the modern internet, digital ads, smartphones, maps, and AI.
Fair Value:US$3405.8% undervalued
140 followersusers have followed this narrative
6 commentsusers have commented on this narrative
18 likesusers have liked this narrative